Work Order Avoidance Dashboard
- Lamont Eddins
- Caroline Antoun
Avoiding issuing a work order is always a great day! Even better is being able to determine how much is actually being saved. The Work Order Avoidance Dashboard allows you to receive a breakdown of avoided work orders and their savings cost. You can view and analyze when work orders are not needed and are classified in Dashboard 2.0. as either duplicates or troubleshooting work orders with support from Decision Tree on the Issue List. At any point in time, you can assess various savings scenarios in order to determine when and why issues are being resolved without the need of a work order. Doing so allows you to evaluate the needs for various locations and become creative with savings.
Even though the amount is shown in USD, it is not associated with a specific currency. It is taking amounts from various currencies and tallying the total as USD. For example, you may have a location in the United Kingdom and Japan, if the amount saved in the UK is £1000 and ¥1500 in Japan, it is converted as $1000 and $1500.
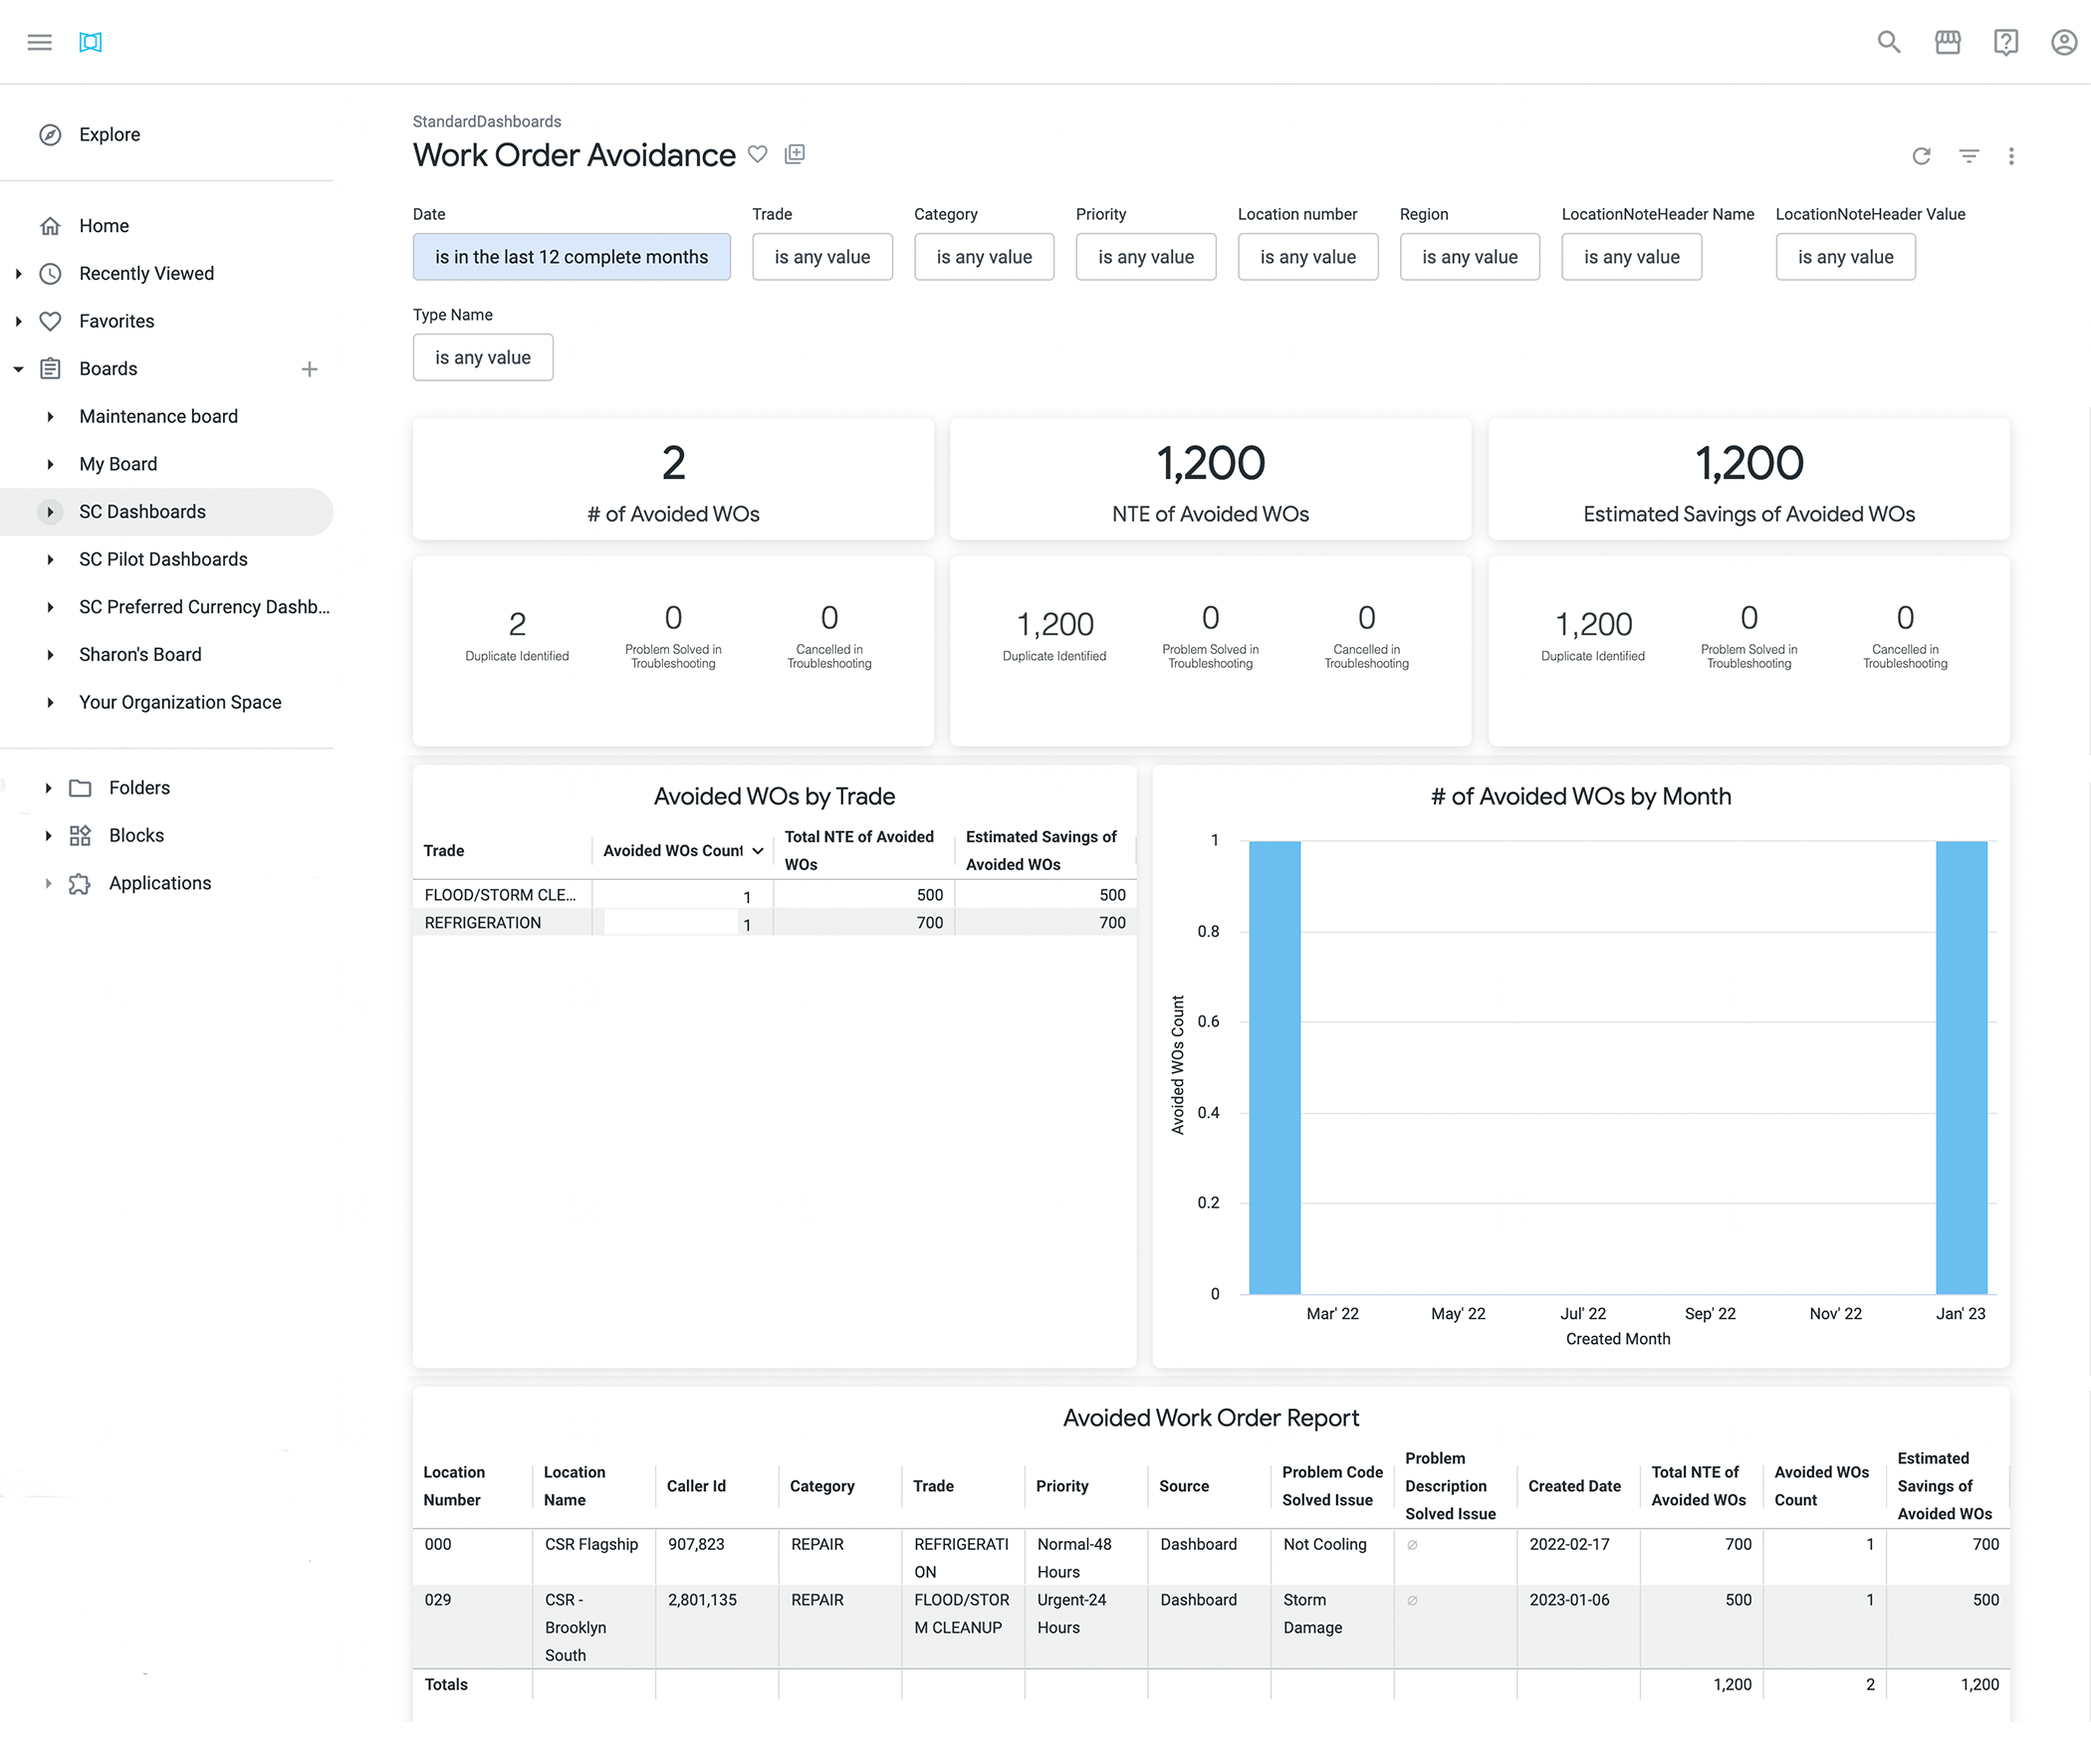
Work Order Avoidance Dashboard is comprised of the following sections:
# of Avoided WOs: Total number of work orders avoided
- NTE of Avoided Orders: Total currency amount saved from avoided work orders
Estimated Savings Avoided WOs: Total amount of average invoice amounts for all trades
Avoided WOs by Trade: Breakdown of avoided work orders by trade that includes total NTE of avoided issues and total estimated by savings invoice amount
# of Avoided WOs by Month: Breakdown of number of avoided work orders per month & year
Avoided Work Order Report: Breakdown of individual avoided work orders
# of Avoided WOs
# Avoided WOs displays the grand total of avoided work orders. This means the original work order was resolved without the assistance of a service provider. The grand total is broken down into three groups:
- Duplicate WorkOrder
- Problem Solved in Troubleshooting
- Cancelled in Troubleshooting
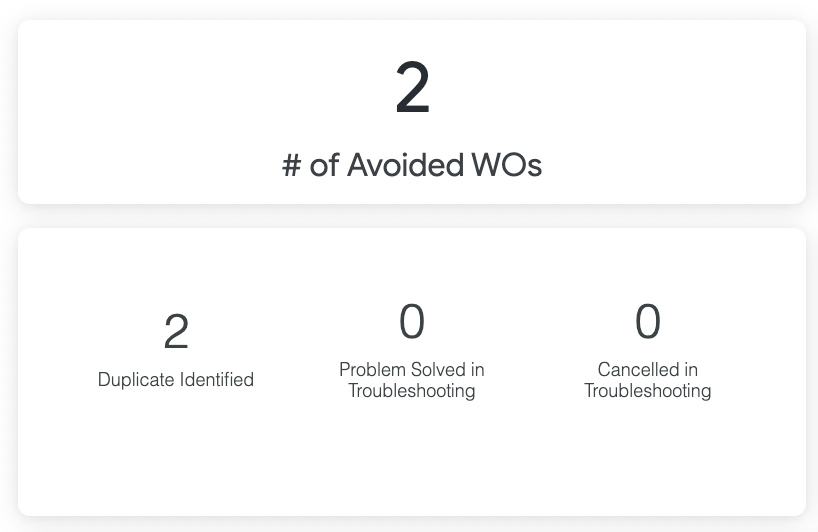
Using the # of Avoided WOs grand total provides a list of all the solved issues whereas Duplicate Identified focuses only on duplicate work orders entered into Dashboard 2.0. and Problem Solved/Cancelled in Troubleshooting will showcase work orders solved by the Decision Tree.
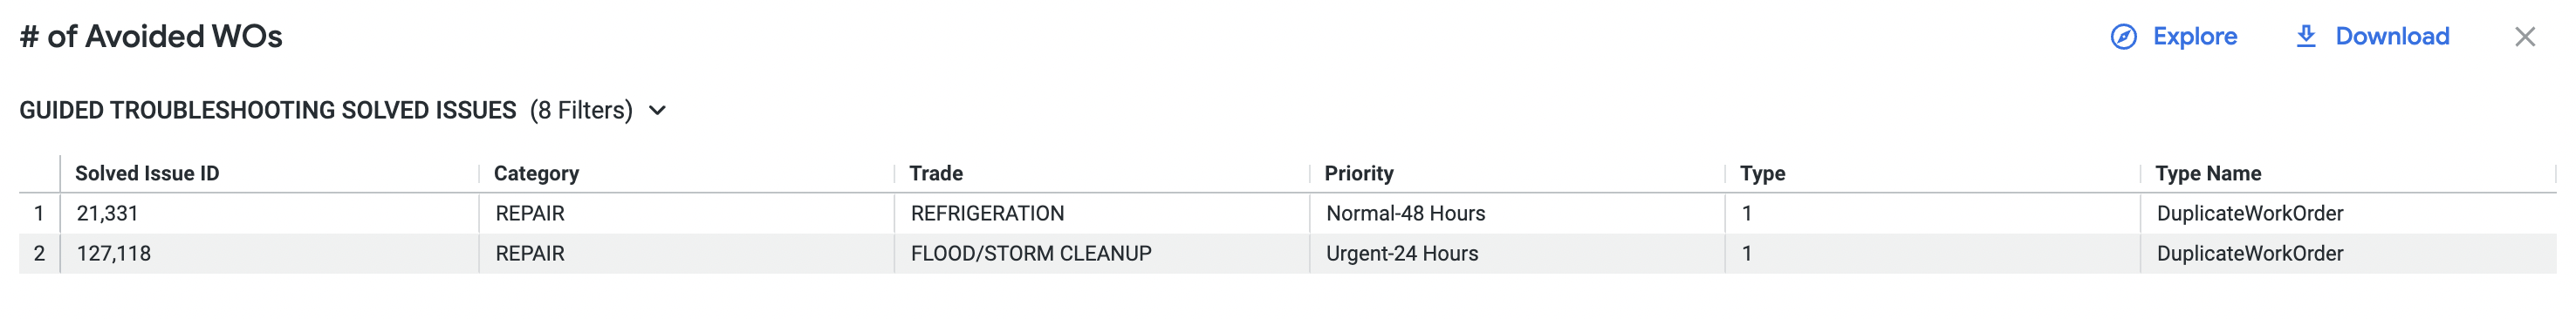
- From the top left-side column, select the # of Avoided WOs to view the report
- Select Duplicate Identified: to only view duplicate work orders
- Select Problem Solved in Troubleshooting: to only view work orders solved in Troubleshooting
- Select Cancelled in Troubleshooting: to only view work orders canceled in Troubleshooting
- A modal appears with the list of # of Avoided WOs
NTE of Avoided WOs
NTE of Avoided WOs determines the total estimated cost of work orders that would be submitted for maintenance or repair. The total cost is broken down into three groups:
- Duplicate Identified
- Problem Solved in Troubleshooting
- Cancelled in Troubleshooting
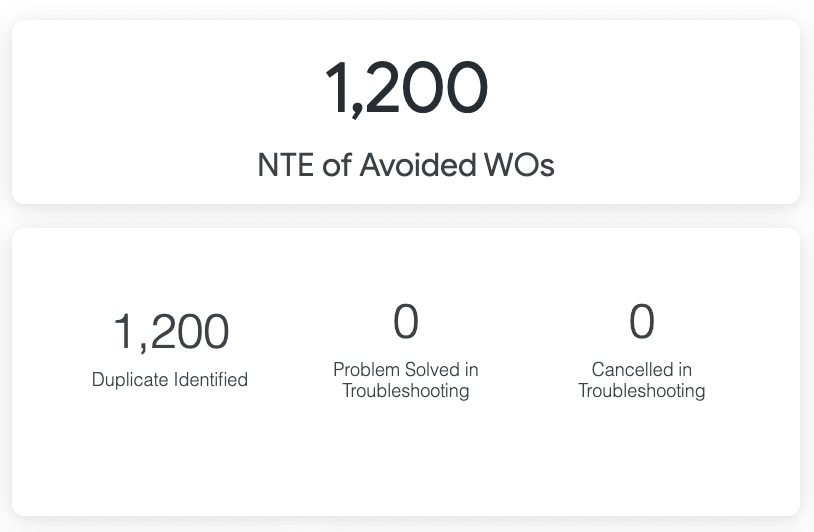
The total amount of NTE of Avoided WOs gives you all the work orders that make up the amount. Further breakdown of the cost can be done by using Total NTE Duplicate WorkOrders, Problem Solved in Troubleshooting, and Cancelled in Troubleshooting.
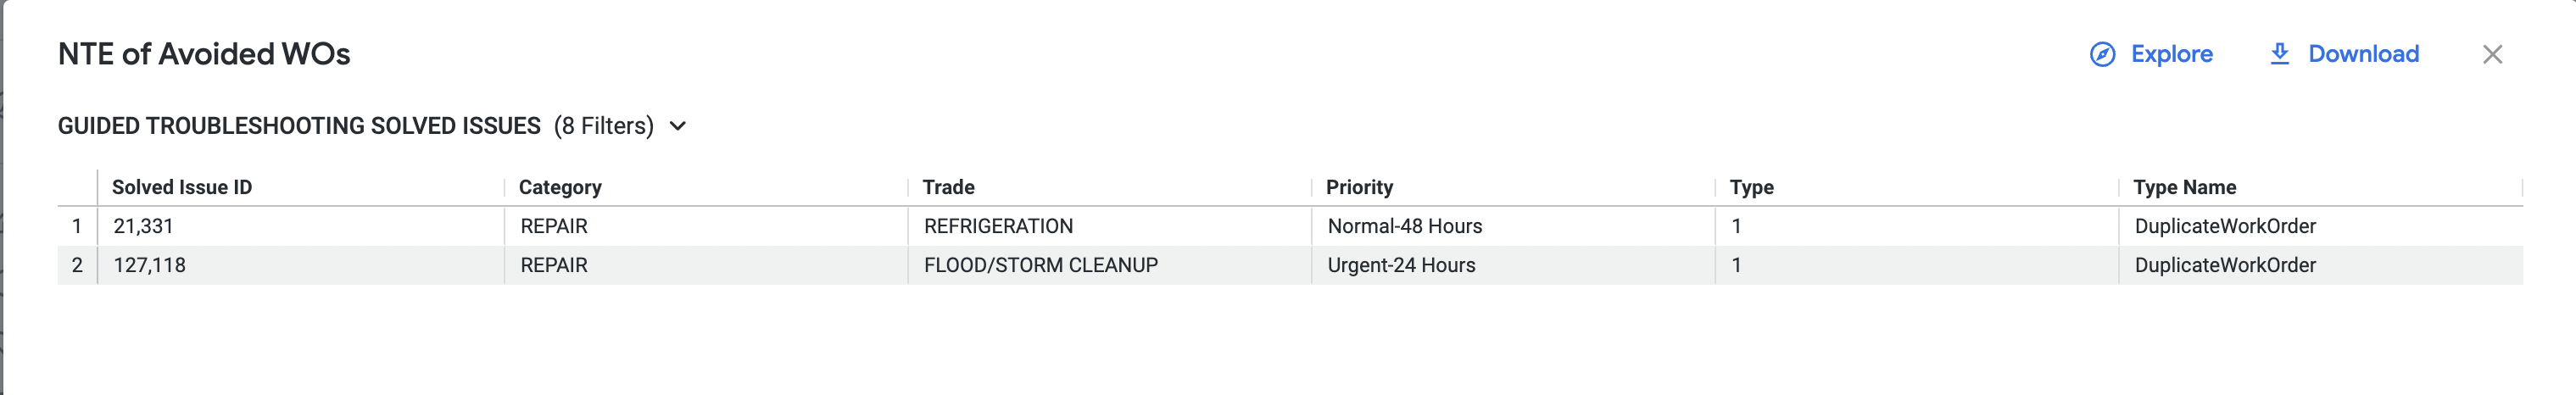
- From the middle columns, select the Total NTE of Avoided Work Orders Amount to view the report.
- Select Duplicate Identified: to only view duplicate work orders
- Select Problem Solved in Troubleshooting: to only view work orders solved in Troubleshooting
- Select Cancelled in Troubleshooting: to only view work orders canceled in Troubleshooting
- A modal appears with the list of NTE of Avoided WOs
Estimated Savings of Avoided WOs
Estimate Savings of Avoided WOs discovers how much on average a work order would have cost based on previous invoiced amounts for that trade. The average amount is broken down into Three groups:
- Duplicate Identified
- Problem Solved in Troubleshooting
- Cancelled in Troubleshooting
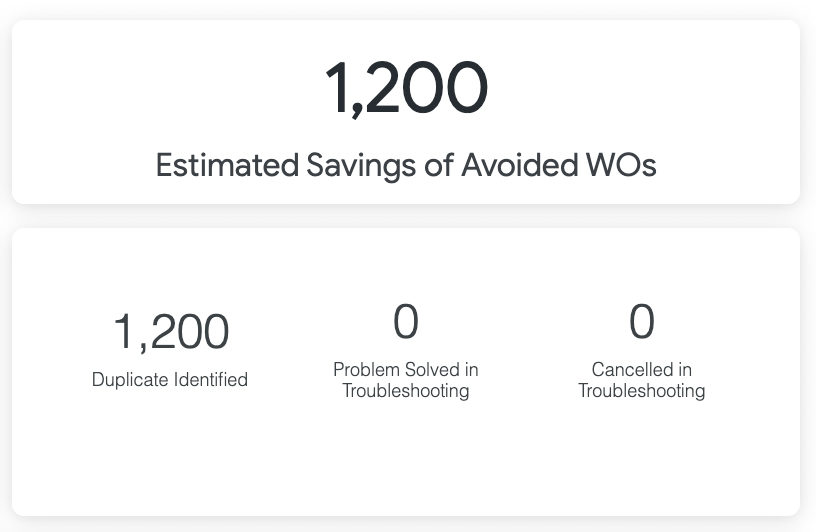
This gives you insight on roughly how much actual savings you will have for not paying service providers for solved work orders. A detailed breakdown can be done with Duplicate WorkOrders, Problem Solved in Troubleshooting, and Cancelled in Troubleshooting.
- From the right-side, column, select Total Estimated Savings of Avoided WOs to view the report
- Select Duplicate Identified: to only view duplicate work orders
- Select Problem Solved in Troubleshooting: to only view work orders solved in Troubleshooting
- Select Cancelled in Troubleshooting: to only view work orders canceled in Troubleshooting
- A modal appears with the list of Total Estimated Savings of Avoided WOs

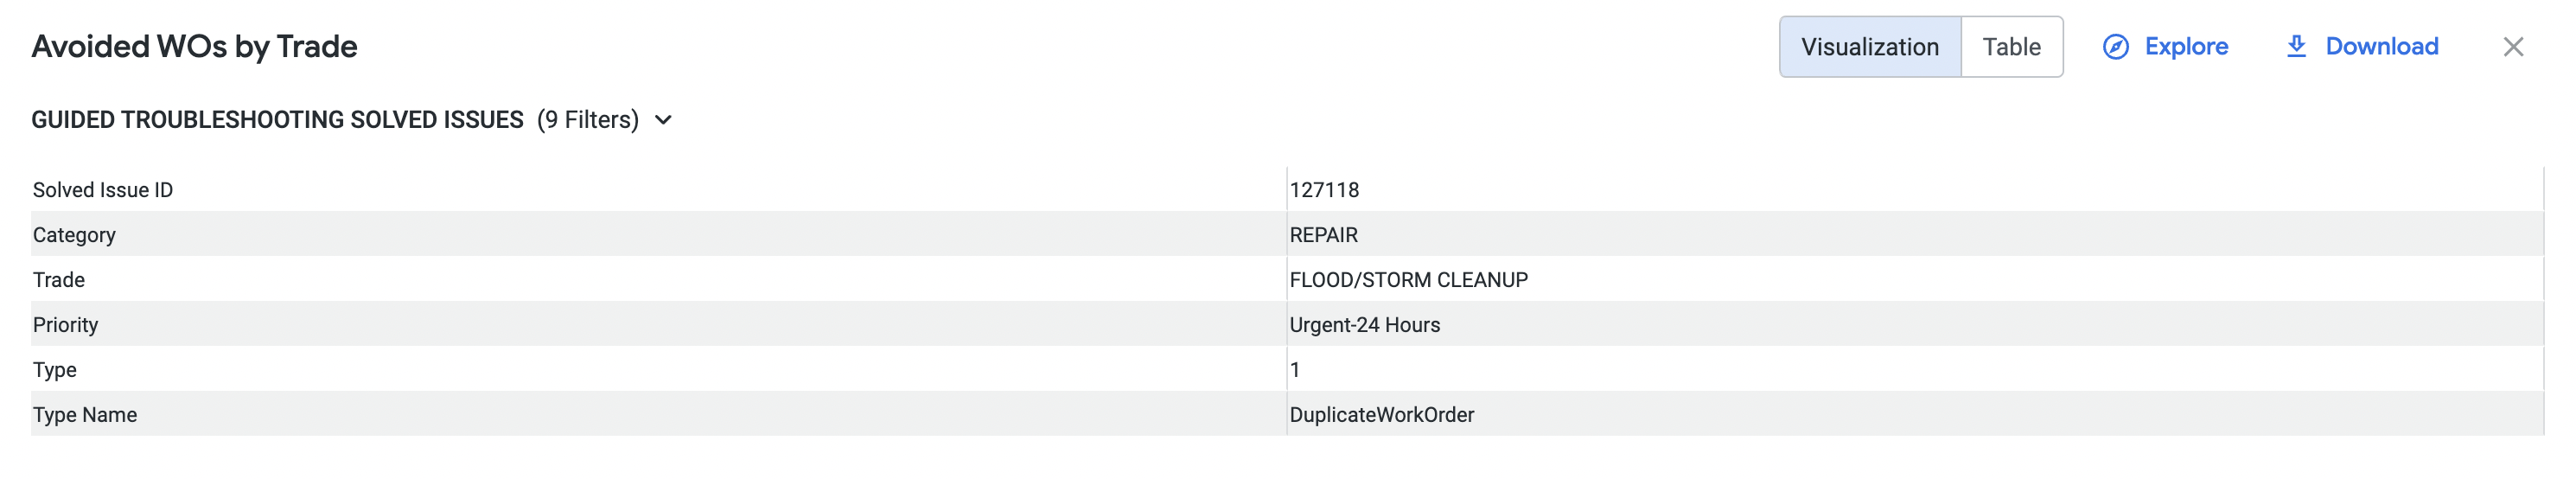
Avoided WOs by Trade
Avoided WOs by Trade establishes which trades are receiving the most problems solved along with the NTE and average invoice amount. You can evaluate avoided work orders by trade which is essential to assess the health of a location and better understanding how issues are being resolved.
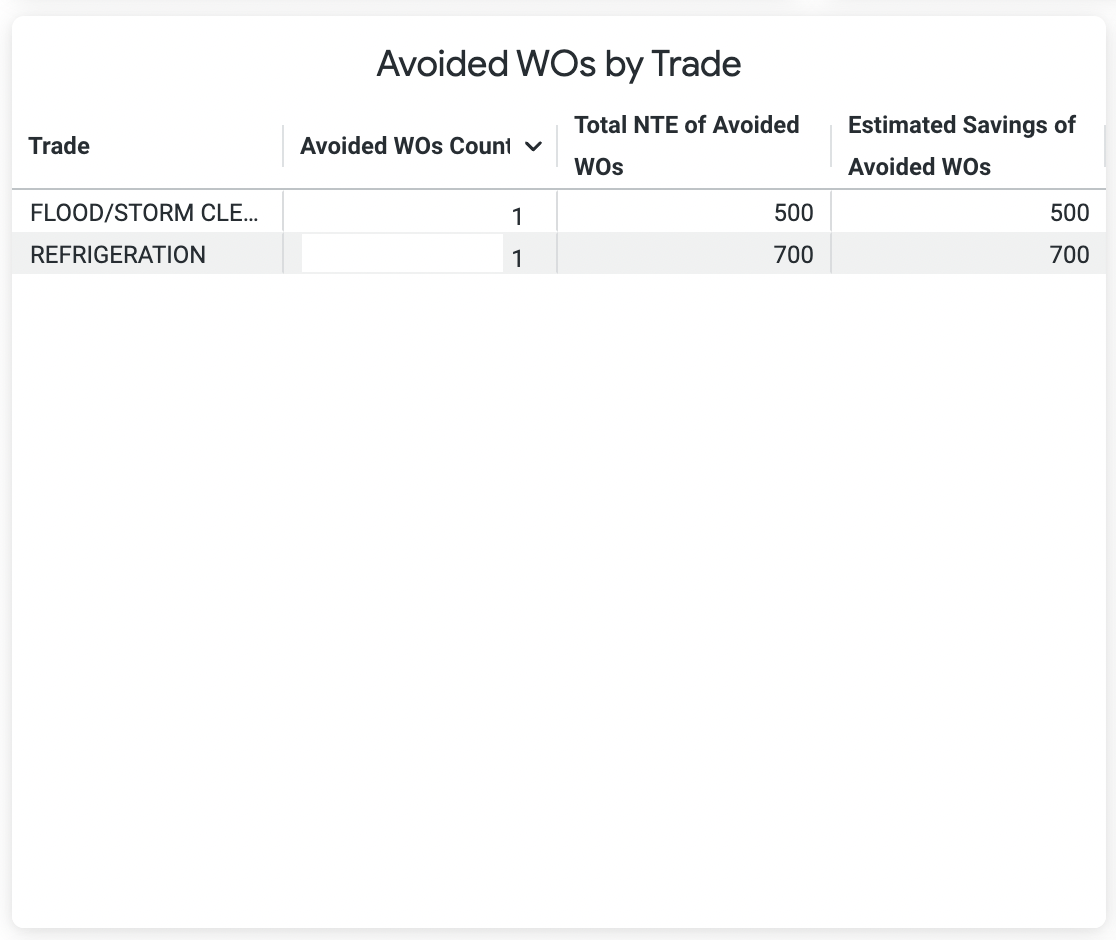
- Select 1 of the 3 to view the report:
- Avoided WOs Count
- Total NTE of Avoided WOs or
- Total Estimated Savings of Avoided WOs
- Based on the selection, a modal appears with the list of Avoided WOs by Trade
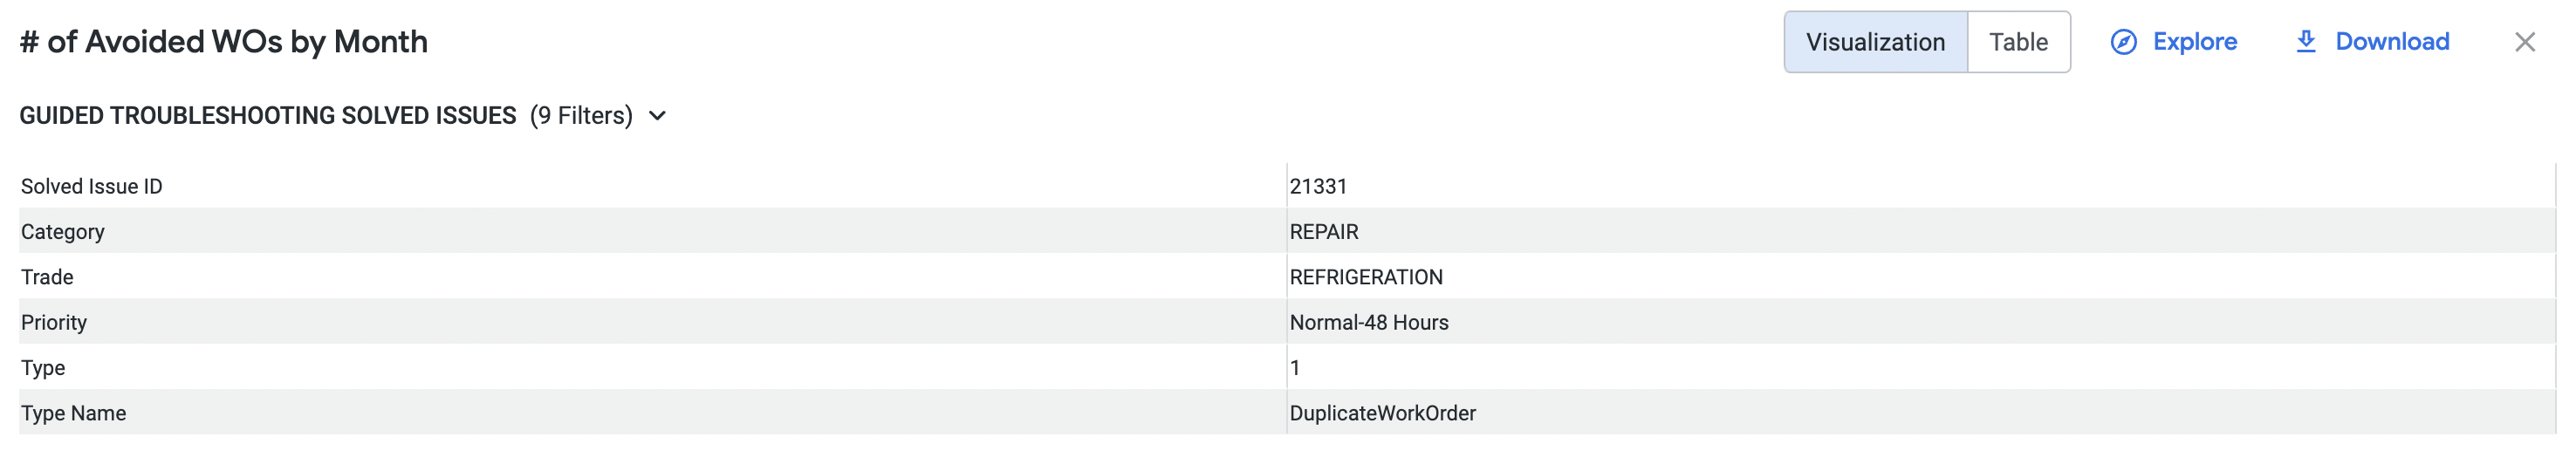
# of Avoided WOs by Month
# of Avoided WOs by Month allows you to evaluate patterns with solved work orders based on a particular month. You can review a chart that exhibits a monthly total for all solved work orders. The chart shows the previous 11 months from the current month.
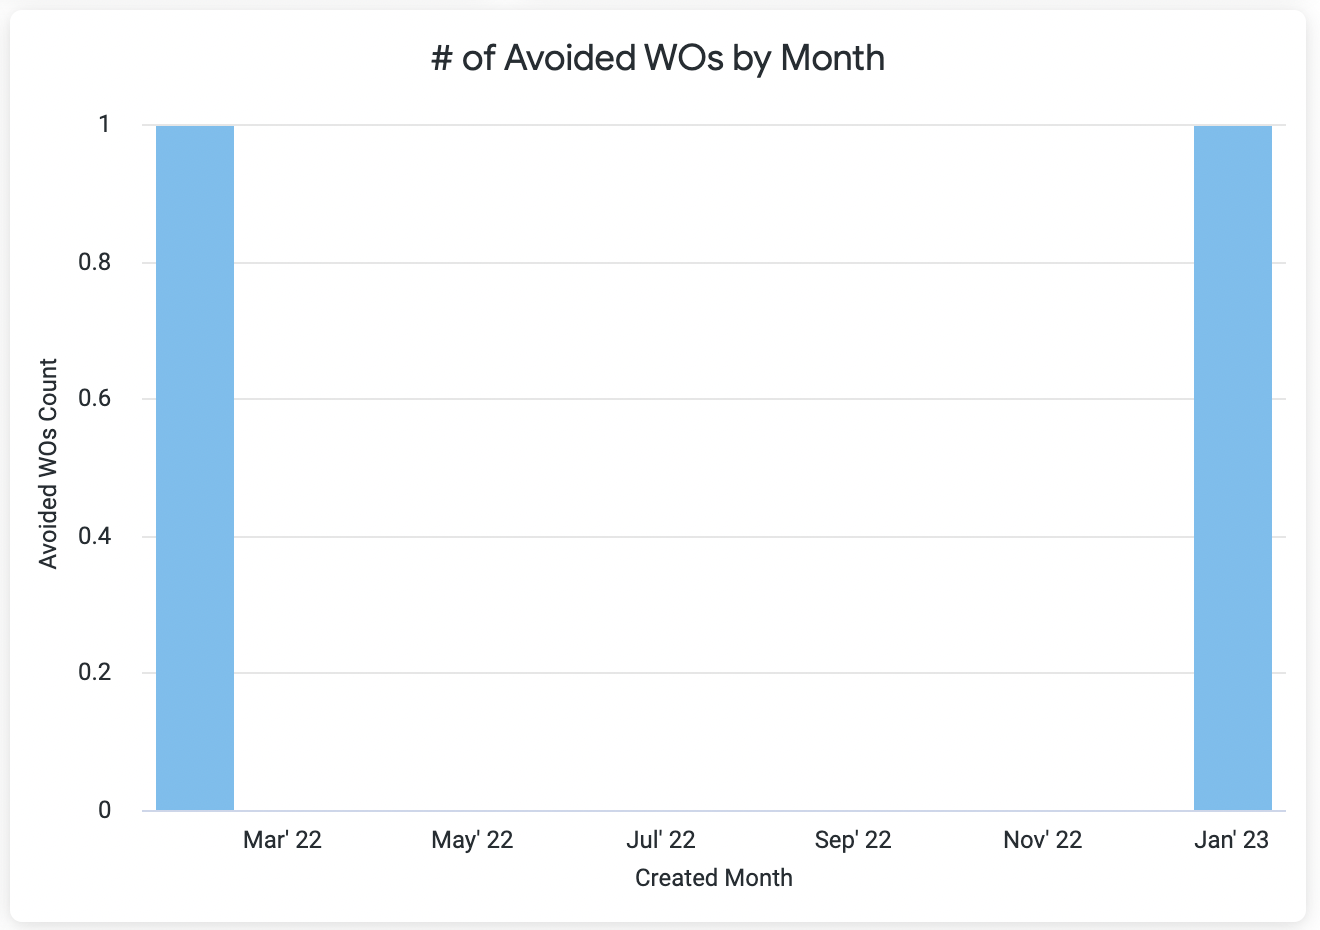
- Select a month from the chart to view the monthly solved work orders
- A modal appears with the list of # of Avoided WOs by Month
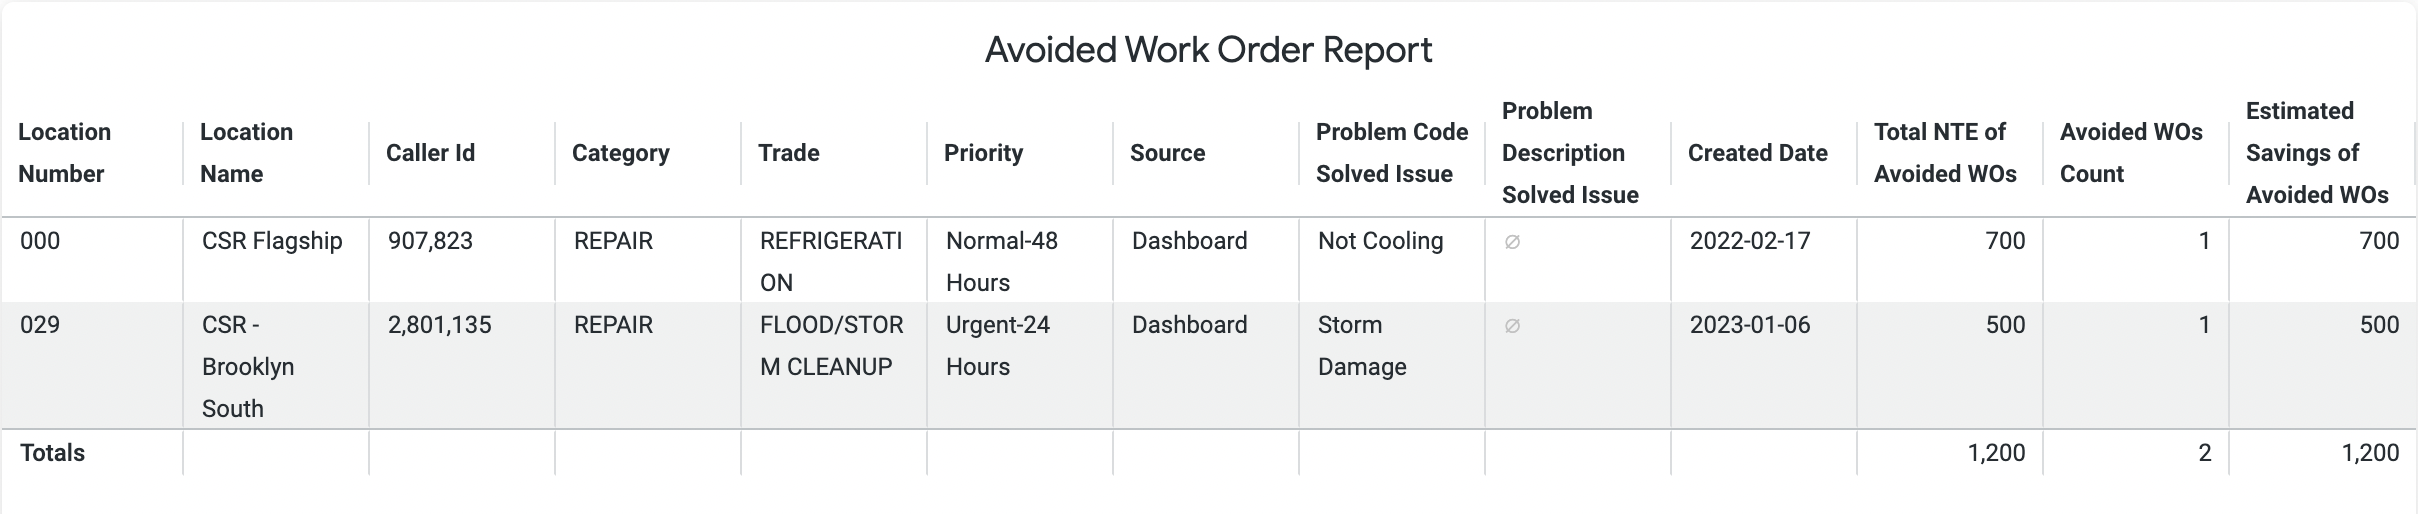
Avoided Work Order Report
Avoided Work Order Report provides you with a detailed analysis of every work order that has been avoided. You are able to receive a complete line of information that pertains to the solved work order. This report combines all the additional reports together into a single report.
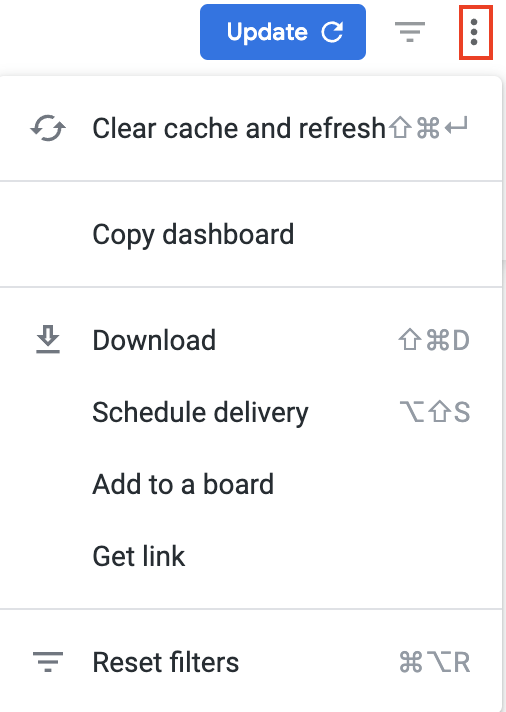
Below is a quick reference guide regarding tracking numbers in Analytics, filtering, sorting, downloading data, and sending reports. Throughout Analytics you can drill down into visualizations to see the underlying data. In most cases, the tracking numbers related to that data are listed. You can click the tracking number to navigate straight to the work order details in Service Automation. On top of the report are all-inclusive filters to help you hone in on key data. All reports on the page are affected by the criteria set in these all-inclusive filters. The filter criteria for each dashboard may differ. Filters reset to the default when the page is refreshed. Click filter field to show the criteria. Select the desired criteria to include or exclude: To Include criteria: select is equal to, contains, starts with, or ends with, and then begin typing the criteria in the picklist. Select the desired criteria (or multiple criteria) from the picklist. To exclude criteria: select is not equal to, does not contain, does not start with, or does not end with. Is null depicts the absence of data in a data set. Conversely, is not null depicts the presence of data To include or exclude data without a certain data criteria — for example, to select data without a Region or District assigned in Service Automation — choose is blank / is not blank. To add more options, click the plus sign (+) next to a field to add another option to the filter. The new option will appear as either an OR condition or an AND condition, depending on the type of filter option. Once all criteria are selected, click Refresh icon in the top-right corner. The Dashboard report updates with the selected criteria. More details are available on Filtering an Analytics Dashboard Analytics tables are dynamic, as you can: In the upper-right corner of any page, click the Vertical Ellipses to download reports, schedule delivery of reports at regular intervals, add to a board, or get a link. You can download data from a table and visualization or download a dashboard tabto PDF or CSV. Select the desired File Format and choose a File Name: A default name is listed but you can change it. On the desired dashboard (or dashboard tab), click the Gear icon in the upper-right of the page, and then click Download as PDF. The Download modal appears. A default Filename appears, but you can change it. Under Advanced options: Single-column format lays out all tables and visualizations on a page into one column in the PDF, as opposed to how it is laid out in the dashboard. Expand tables shows all rows in a table, instead of just the rows that appear on the dashboard. Paper size adjusts the PDF to your desired size. Click Open in Browser to view the PDF in your chosen browser, or click Download to save a version of the report onto your device. On the desired dashboard (or dashboard tab), click the Gear icon in the upper-right of the page, and then click Download as CSVs... A new browser tab opens. After the files render, you are prompted to save the CSV Zip file onto your device. More details are available on Downloading and Sending Dashboards and Reports You can also Send a one-time report via email or Schedule a recurring email send.Commonly Used Features
Tracking Numbers in Analytics
Filtering Dashboards
![]()
Dynamic Table Sorting
Downloading and Sending Reports