About Analytics
- Chellie Esters
- Caroline Antoun
- Natalia Larina (Unlicensed)
- Jason Gauntz (Unlicensed)
Analytics allows you to view facilities data in a powerful platform. Facility operators and decision-makers can discover, visualize, manage, and predict data in one place so you can manage your repair and maintenance spend and determine facilities ROI on overall operations.
Through Analytics, you can tell the story of what is happening in your facilities operations throughout your organization. Questions such as, “Which locations or regions are spending the most on repairs?” or “Should I give more work to lower-ranked Service Providers because their KPI scores are higher than my Rank 1 Provider?” or "Can I justify a request for a budget increase at the next executive meeting?" can be answered using data analysis and visualizations.
There are 2 levels for Analytics:
- Standard Analytics gives you out-of-the-box dashboards for an array of data: work orders, invoices, proposals, assets, facilities operational costs, contractor scorecards and key performance indicators for providers, user permissions, checklists, projects, resolution/root cause, labels, and NTE data.
Premium Analytics (Explore) allows for custom builds of complex visualizations, custom data fields, and spreadsheet function imports for use in organizational looks and dashboards that you can share with others within your company.
- Standard Analytics is available to all ServiceChannel subscribers. A maximum of 5 user licenses are available, but you can set up anyone in your organization to receive emailed reports, regardless of their access to Service Automation.
- Premium Analytics is an add-on to Standard Analytics. Please contact your ServiceChannel representative to turn on Premium Analytics with the number of user licenses required.
Within Analytics you can:
- View reports — called “Dashboards” — compiled everyday data into visualizations that tell the story of what is happening in your operations, brand uptime, and repair and maintenance spend.
- Filter your data, and then share them across your organization in interactive PDFs, CSVs, or Visualizations. You can also ‘set it and forget it’ by scheduling when these reports should be sent to your colleagues.
- Data and Visualization Experts with Premium Analytics can build specialized reports and dashboards that go beyond standard Dashboards for an even deeper view of the data, building the stories that matter. You can give access to these reports and dashboards in Analytics to users with a light license to view only.
- Use complex Excel formulas to build data stories and keep them together in one place.
Accessing Analytics
You can access Analytics once you are granted access by your ServiceChannel administrator.
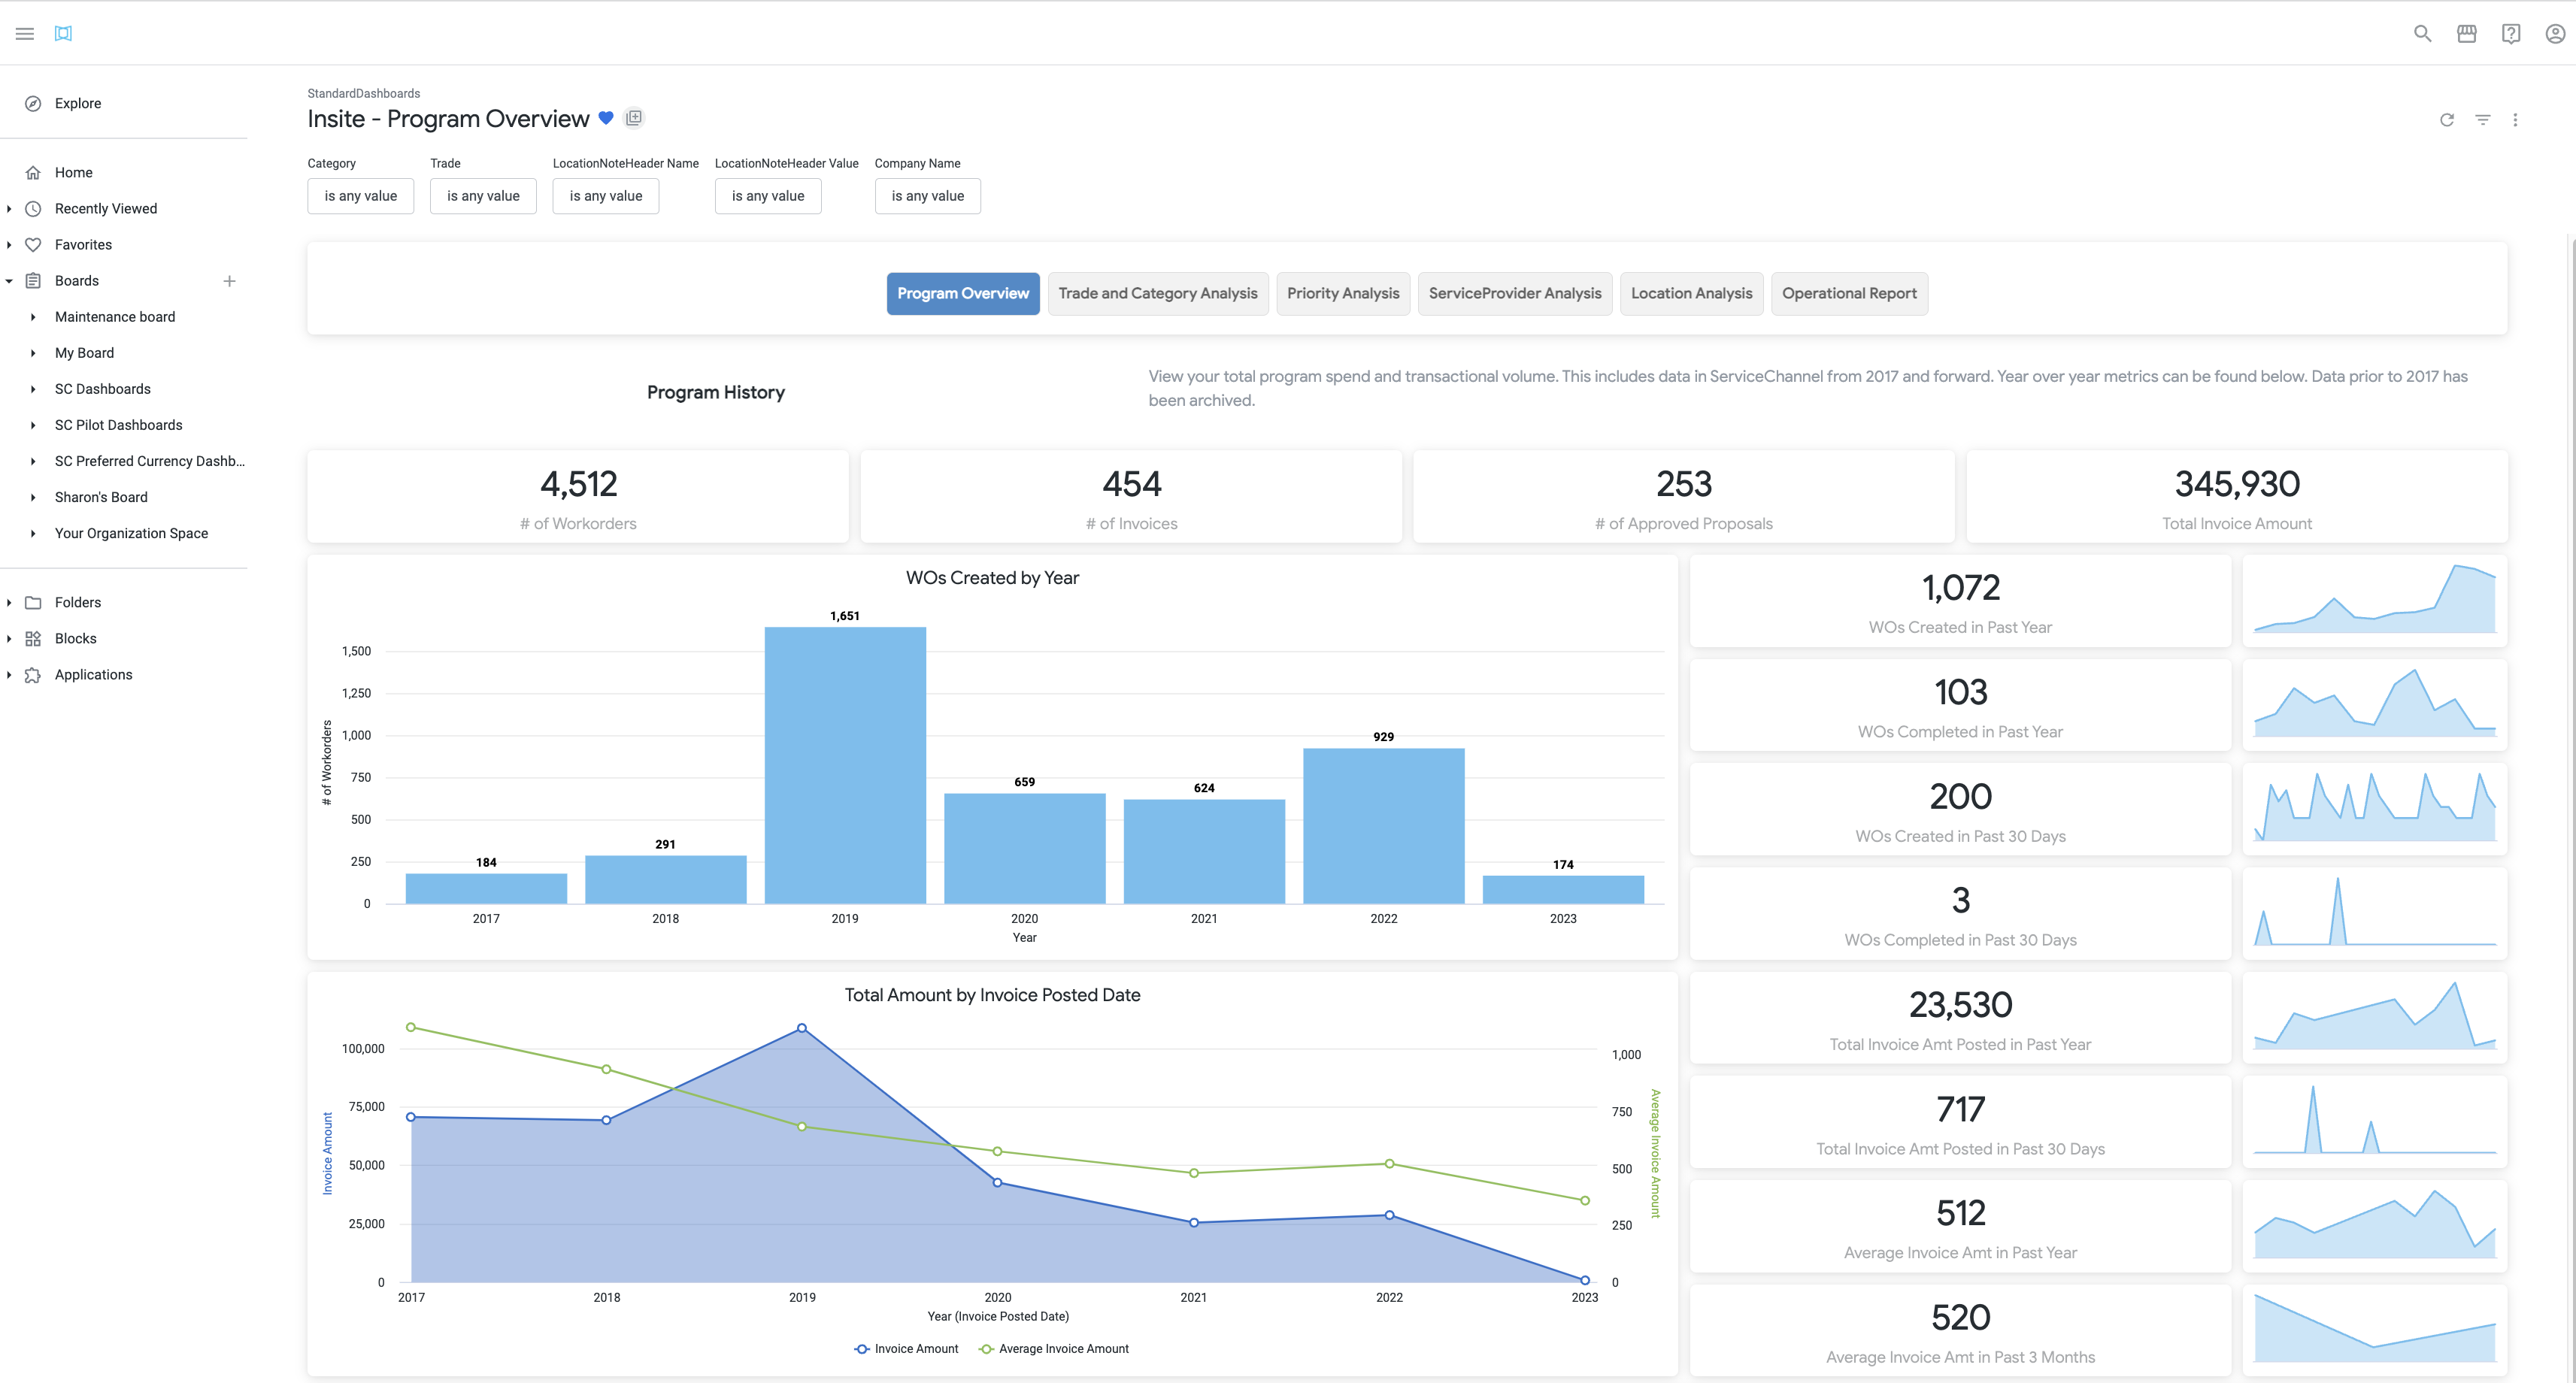
- In the navigation menu, go to Analytics. Analytics appears with the *Insite Dashboard displayed.
Granting Access to Analytics to Other Users
When granting an Analytics license, first ensure the user has a valid email address on the account, and then assign the Analytics license.
ServiceChannel Admin users with the Analytics Admin secondary permission can assign licenses to users.
- In the navigation menu, go to Admin > Permissions > Users. The Users list appears.
- Use the Search bar to locate the desired user.
- To the right of the user, click the pencil to edit the user's permissions.
- On the top, click the General Info tab.
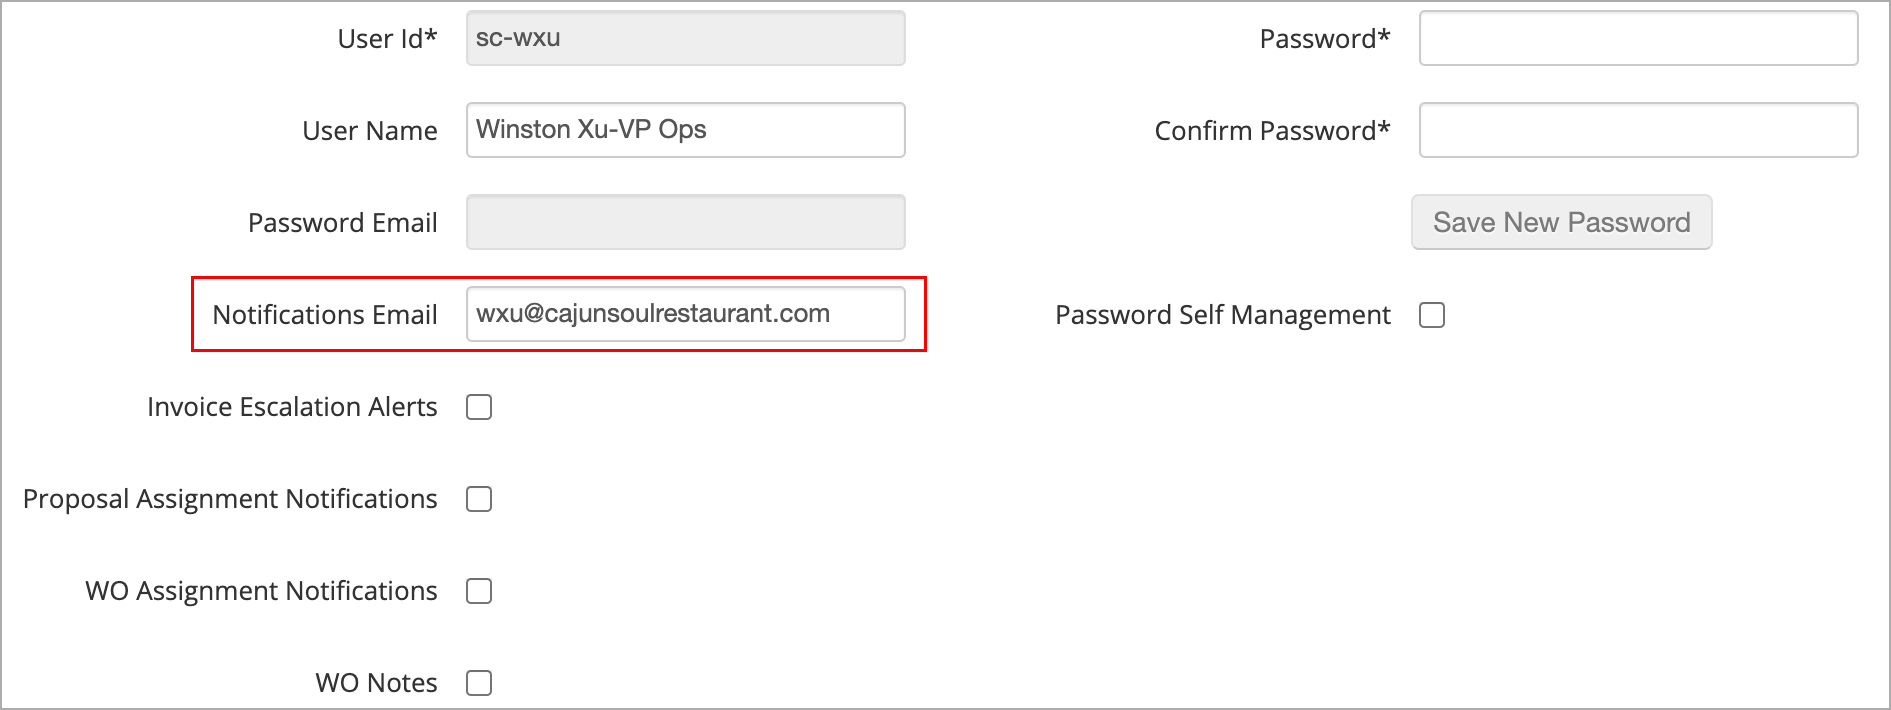
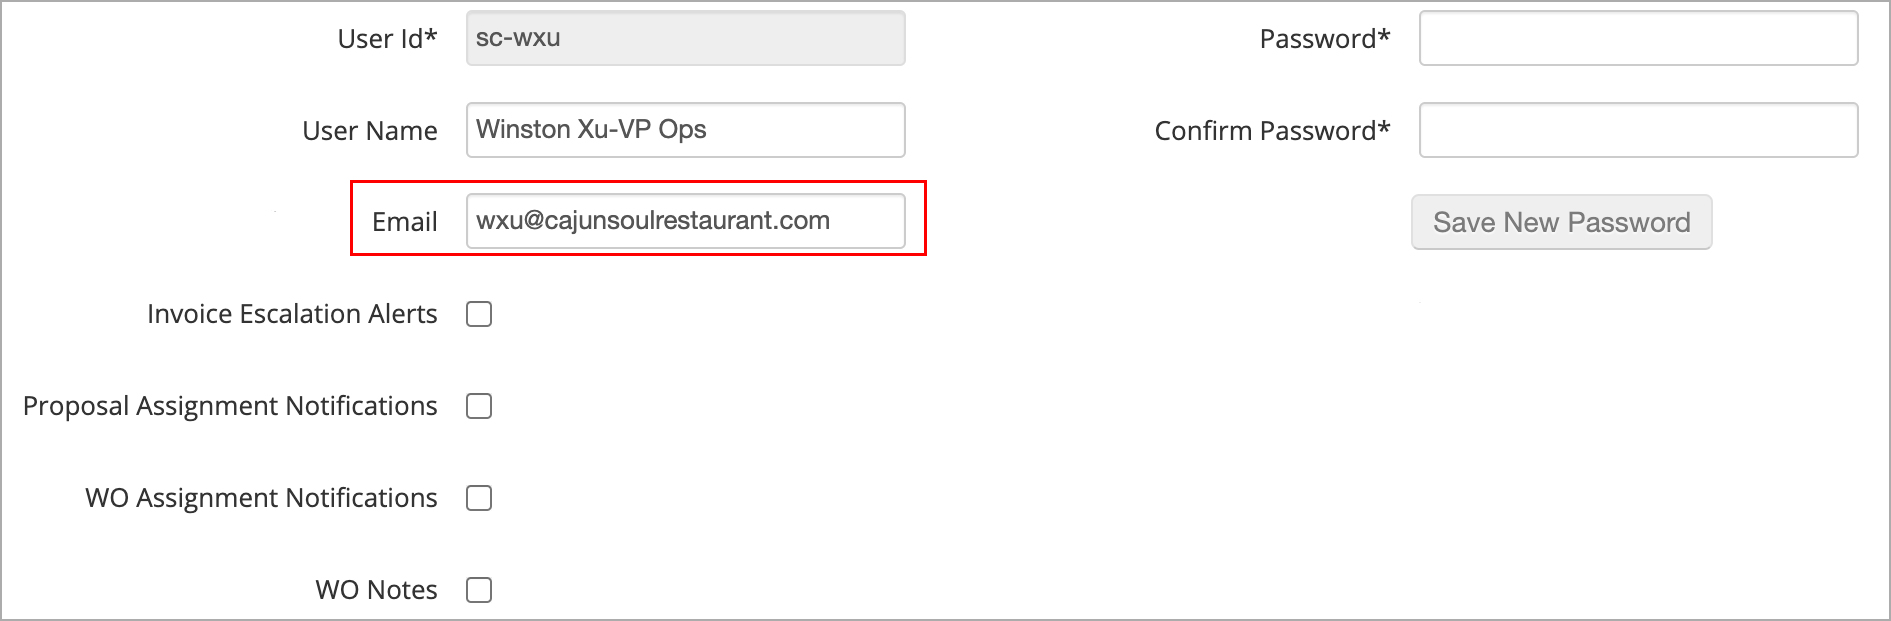
Ensure the user has a valid email address listed:
Accounts using Password Self Management: Enter the email in the Notifications Email field.
Accounts without Password Self Management: Enter the email in the Email field.
- Click Save on the lower-right of the panel, and then click the Analytics tab on the top of the page.
- Choose the desired Current license:
- (Standard Analytics Users) Select Light, and then click Apply License Type.
- (Premium Analytics Users) Select either Light for view-only access or Pro for edit and chart-building access, and then click Apply License Type.
- Click Save on the lower-right of the panel.