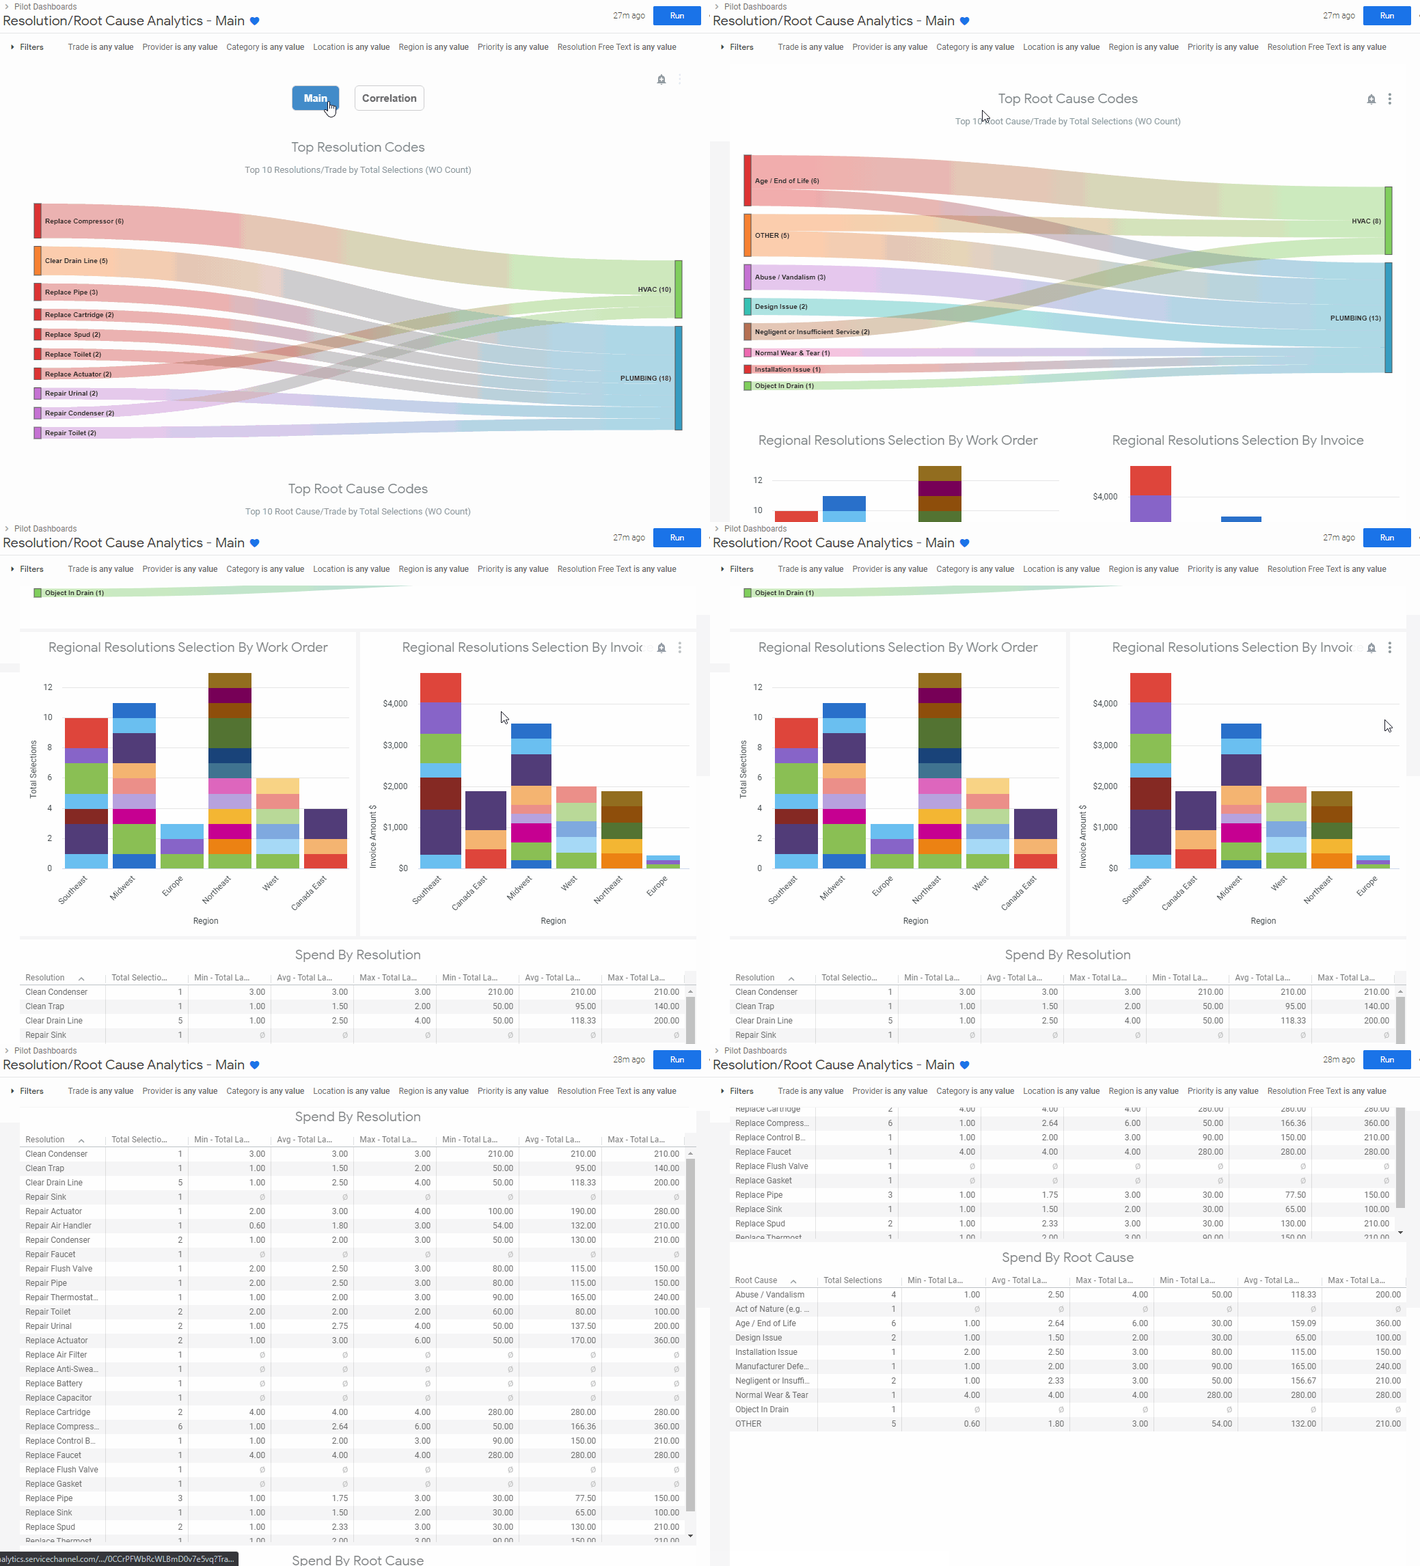
The Resolution/Root Cause Analytics dashboard helps you view breakdowns and spend by resolution and root cause as well as correlations between both.
The resolution and root cause codes are standardized based on the primary trade a work order belongs to. It means that no matter which provider — your FTM internal technician or an external provider — completes a work order, they will see a standardized list of resolution and root cause codes, which also appear on your work order once a technician checks out.
Using the data aggregated on the Resolution/Root Cause Analytics dashboard, you can:
- Have a better understanding of what was done on-site
- Better predict and prevent recurring issues with your equipment
- Estimate the overall facility healthiness and focus on ‘unhealthy’ locations at a regional level
- Make strategic sourcing decisions on providers

Reports Available in This Dashboard
The dashboard is divided into 2 tabs:
- The Main tab shows the breakdown of top resolutions and root causes per trade and region as well as spend and labored hours breakdown by resolution or root cause.
- The Correlation tab demonstrates the interconnection between resolutions, root causes, and problem codes.
