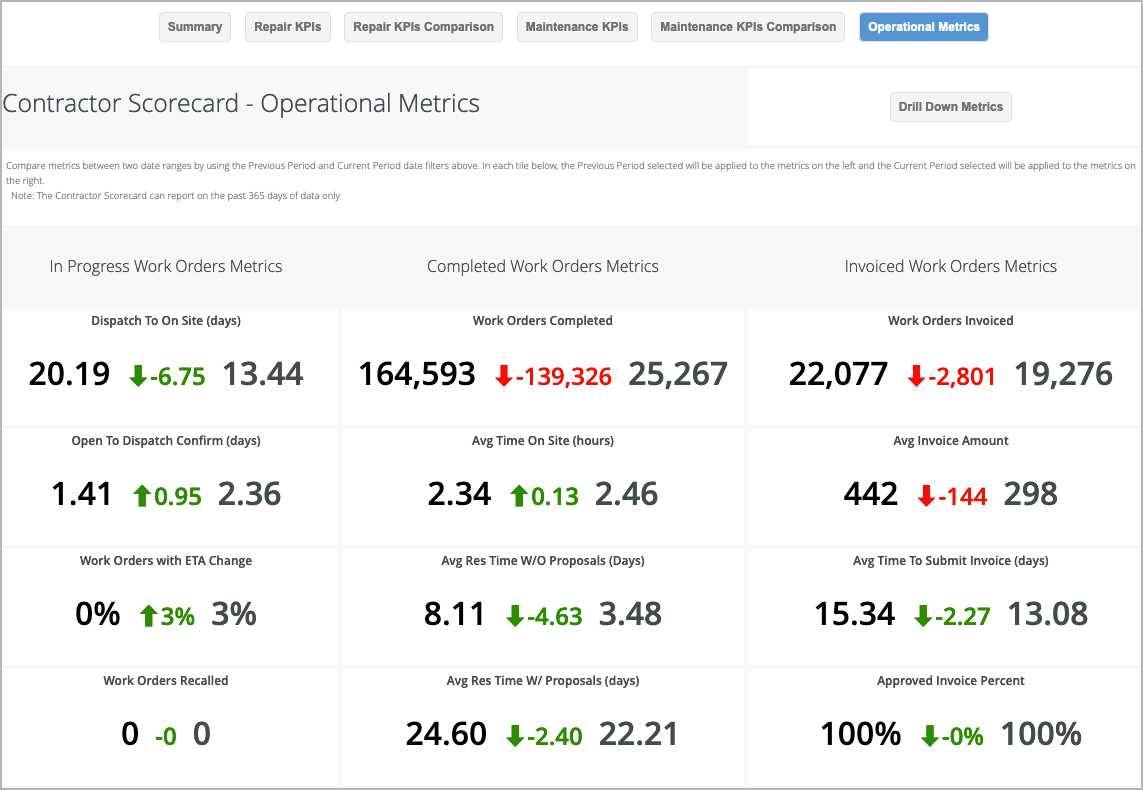
In the Operational Metrics tab, you can compare metrics over two periods for Open/In Progress, Completed, and Invoiced work orders over the past 365 days (or a date range you specify). Reviewing data across all clients gives you an overall view of your operations; while reviewing these metrics for one client gives a clear picture of whether behaviors — such as average time on site or work orders recalled — are trending in the right direction with your client's expectations.
You can filter the date range to see the operational metrics for a specific time frame by using the Previous Period and Current Period filters.
By default, the metrics illustrate data for all clients (Subscribers) within the past 365 days. Use the Subscriber filter in the all-inclusive filters along the top of the report to view by individual Clients, different date ranges, or other criteria, as needed.
When comparing data, pay attention to the trend arrows.
- Metrics with green trend arrows illustrate a positive trend, whether upward or downward.
- For example, Dispatch to On Site trends positive as the comparison metric decreases, while Average Time On Site trends positive as the metrics increase.
- Metrics with red trend arrows illustrate a negative trend, also whether upward or downward.
- For example, Average Resolution Time with Proposal trends negative as numbers increase, while Average Invoice Amount trends negative as values decrease.
The following Operational Metrics are in this dashboard:
- Open/In Progress Work Order Metrics:
- Dispatch to On Site (days): The number of days between when a work order is dispatched and when your company arrives on site.
- Open to Dispatch Confirm (days): The number of days between when a work order is dispatched and when your provider company accepts the work order.
- Work Orders with ETA Change: The number of work orders where the scheduled date is updated.
- Work Orders Recalled: The number of work orders that are marked as Recall.
- Invoiced Work Order Metrics:
- Work Orders Invoiced: The number of work orders that have been invoiced.
- Avg Invoice Amount: This metric averages the monetary amount of all issued invoices.
- Avg Time to Submit Invoice (days): The average number of days that elapse between completing a work order (confirmed by the client as completed with Completed or Completed/Confirmed status) and the service provider submitting the invoice (invoice posted date).
- Approved Invoice Percent: The percentage of submitted invoices that are approved, indicating the accuracy of invoices.
- Avg Time To Approve Invoice (days): The time elapsed between invoice posted date and invoice approved date.
- Work Orders with NTE Changed: The number of work orders with a modified NTE.
- Completed Work Order Metrics
- Work Orders Completed: The total number of work orders completed.
- Avg Time On Site: The average time you or your technicians have spent on site to complete work orders.
- Avg Resolution Time Without Proposals (days): The average number of days that elapse from the work order creation date to the completion date for work orders that do not have proposals. Time on site is calculated as the time between the first check in and the last check out on a work order.
- Avg Resolution Time With Proposals (days): The average number of days that elapse from the work order creation date to the completion date for work orders with proposals.
- Avg Proposal Turnaround Time (days): The average number of days that elapse from when it was determined a work order required a proposal to the time your company submits the proposal to the client. It is calculated as the difference between the proposal date (when the proposal was available in Service Automation) and the date when the extended status of the work order was set to "waiting for quote."
- Avg Time to Approve Proposals: The average number of days that elapse between a client receiving a proposal (Proposal Date) and approving (Proposal Approval Date).
Drilling Down into Operational Metrics
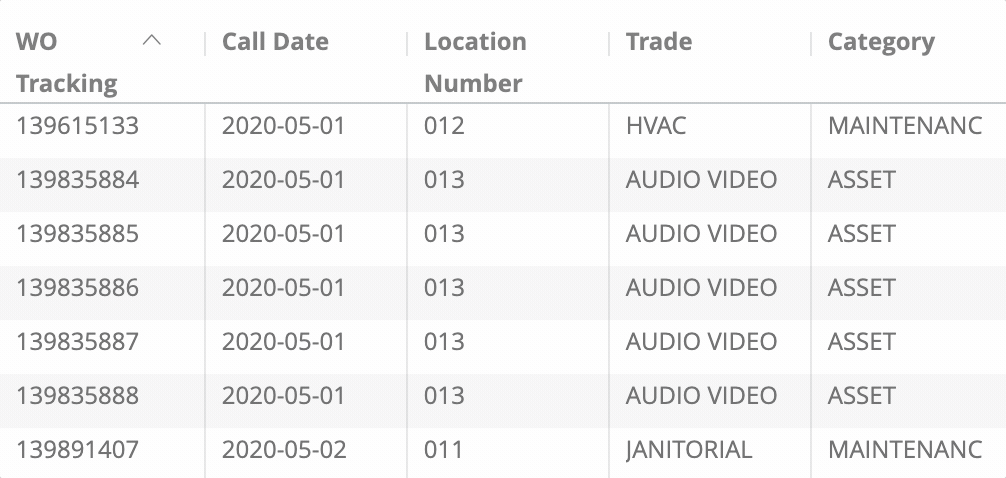
By clicking on the name of each metric, you can drill down into each metric to view the related tracking numbers during the last completed month.
You can also click Drill Down at the top of the visualization to view metrics for Completed and Invoiced work orders. Here, you can view visualizations of average scores by day of the month and/or view related work order information. These visualizations help you quickly identify the trends for the metrics and when the performance was above or below the average.
Drilling down the value for a metric displays the list of work orders driven by that metric. Drilling down into the related visualization shows the data broken down by the day for the past 1 complete month.
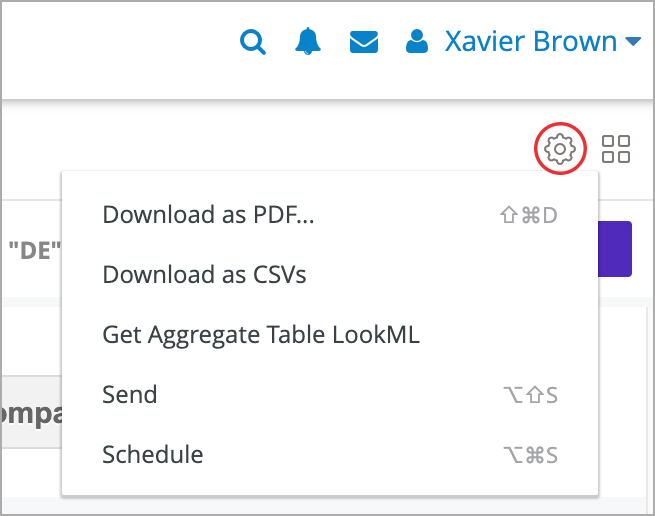
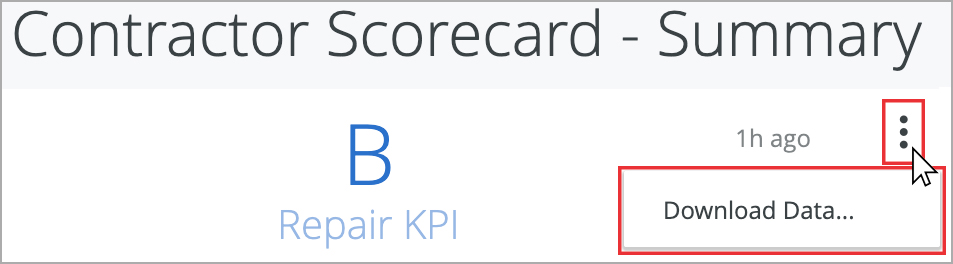
Below is a quick reference guide regarding tracking numbers in the Scorecard, filtering, sorting, downloading data, and sending reports. Throughout the Contractor Scorecard, you can drill down into visualizations to see the underlying data. In most cases, the tracking numbers related to that data are listed. You can click the tracking number to navigate straight to the work order details in Service Automation. On top of the report are all-inclusive filters to help you hone in on key data. All reports on the page are affected by the criteria set in these all-inclusive filters. The filter criteria for each dashboard may differ. Filters reset to the default when the page is refreshed. Click the triangle next to Filters to show the criteria. Select the desired criteria to include or exclude: To Include criteria: select is equal to, contains, starts with, or ends with, and then begin typing the criteria in the picklist. Select the desired criteria (or multiple criteria) from the picklist. To exclude criteria: select is not equal to, does not contain, does not start with, or does not end with. Is null depicts the absence of data in a data set. Conversely, is not null depicts the presence of data To include or exclude data without a certain data criteria — for example, to select data without a Region or District assigned in Service Automation — choose is blank / is not blank. To add more options, click the plus sign (+) next to a field to add another option to the filter. The new option will appear as either an OR condition or an AND condition, depending on the type of filter option. Once all criteria are selected, click Run in the top-right corner. The Dashboard report updates with the selected criteria. More details are available on Filtering in the Contractor Scorecard. Analytics tables are dynamic, as you can: In the upper-right corner of any page, click the Gear icon to download reports, send reports, or schedule reports to send at regular intervals. You can download data from a table and visualization or download a dashboard tabto PDF or CSV. Select the desired File Format and choose a File Name: A default name is listed but you can change it. On the desired dashboard (or dashboard tab), click the Gear icon in the upper-right of the page, and then click Download as PDF. The Download modal appears. A default Filename appears, but you can change it. Under Advanced options: Single-column format lays out all tables and visualizations on a page into one column in the PDF, as opposed to how it is laid out in the dashboard. Expand tables shows all rows in a table, instead of just the rows that appear on the dashboard. Paper size adjusts the PDF to your desired size. Click Open in Browser to view the PDF in your chosen browser, or click Download to save a version of the report onto your device. On the desired dashboard (or dashboard tab), click the Gear icon in the upper-right of the page, and then click Download as CSVs... A new browser tab opens. After the files render, you are prompted to save the CSV Zip file onto your device. More details are available on Downloading and Sending Dashboards and Reports You can also Send a one-time report via email or Schedule a recurring email send.Commonly Used Features
Tracking Numbers in Analytics
Filtering Dashboards

Dynamic Table Sorting
Downloading and Sending Reports