Downloading and Sending Dashboards and Reports
- Chellie Esters
The Scorecard provides you with many ways to download and/or send dashboards and data. From any dashboard you can:
Download data from a table and visualization
Download a dashboard in PDF or CSV
Send a one-time report of a dashboard to email recipients
Schedule a recurring report sent to email recipients
Downloading Data
Downloading Data from a Table or Visualization
On any table or visualization, you can download the underlying data to the formats Excel (2007 or later), CSV, TXT, or PNG. (For data experts, JSON, HTML, and Markdown formats are also available.)
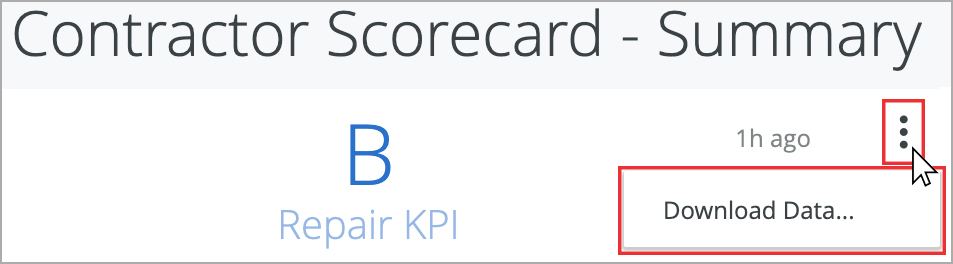
- On the desired table or visualization, hover over the upper-right to expose the 3 dots menu, and then click Download Data. The Download modal appears.
Select the desired options:
Mostly, you would leave these settings unchanged and then click Download, but we have provided what these options mean below.
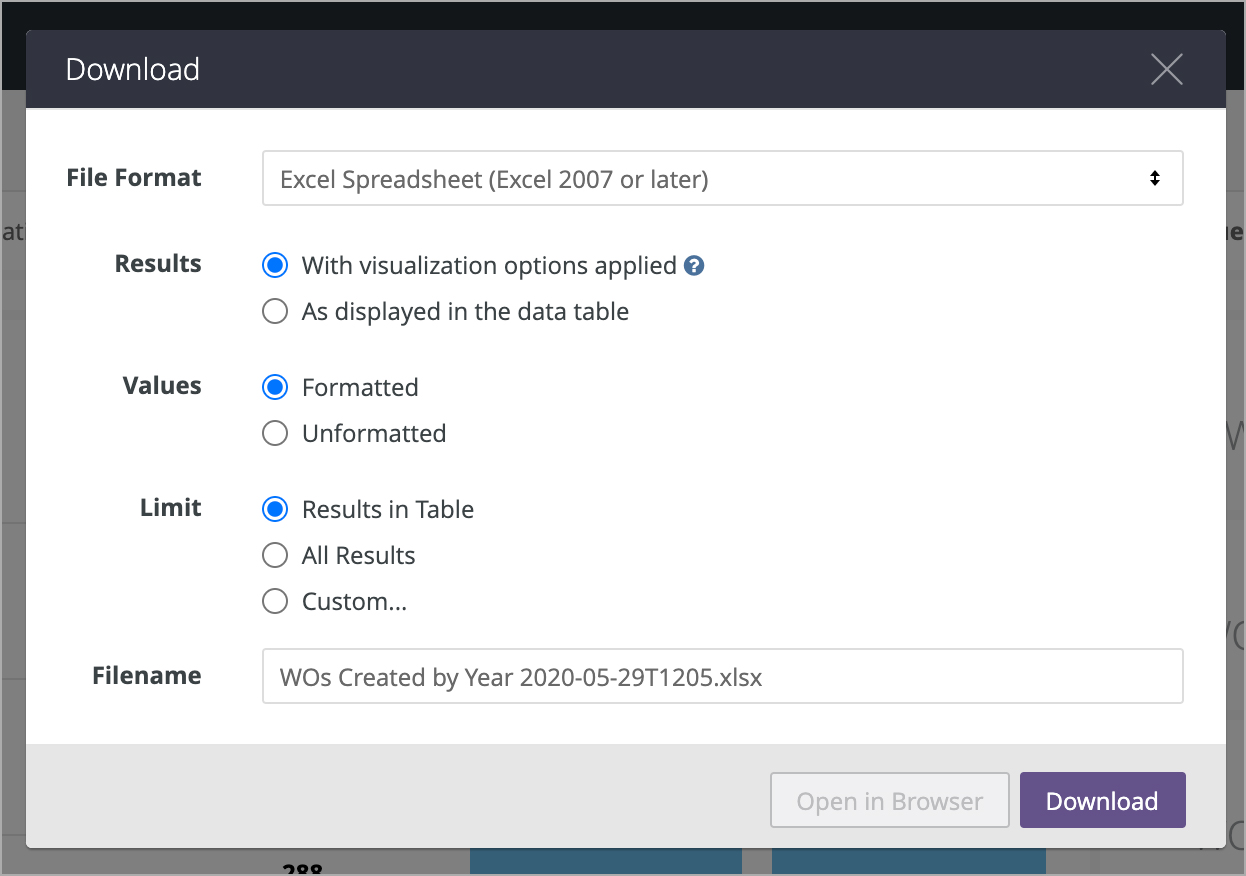
File Format: Download the data in Excel (2007 or later), CSV, TXT, or PNG. (For data experts, JSON, HTML, and Markdown formats are also available.)
- Results: Leave on With visualization options applied to download the data the way it appears on the dashboard. In other words, chart builders may have changed the names of column headers, chart legends, or X and Y graph labels to make the data easy to view in the dashboard. Keeping this option checked retains that view.
- To view the actual Dimensions, Measures, and data fields used to build the chart, change this setting to As displayed in the data table.
- Values: Leave on Formatted to see the data with relative decimals, percentages, commas, and the like. To change to more of a raw data format, change this setting to Unformatted.
- Limit: Leave on Results in Table to return the data as-is.
- Use All Results to download all data that is related to this chart.
- For example, the chart builder may have used 500 rows of data, but then limited the visualization to only view the top 100.
Use Custom to download a certain number of rows of data.
For example, the chart builder may have used 500 rows and the chart uses the top 100 rows, but you want to see 300 rows of data.
The maximum number of rows that can be downloaded at one time is 5,000.
- Use All Results to download all data that is related to this chart.
File Name: A default name is listed but you can change it.
- Click Download to save the file to your device.
Downloading a Dashboard to PDF or CSV
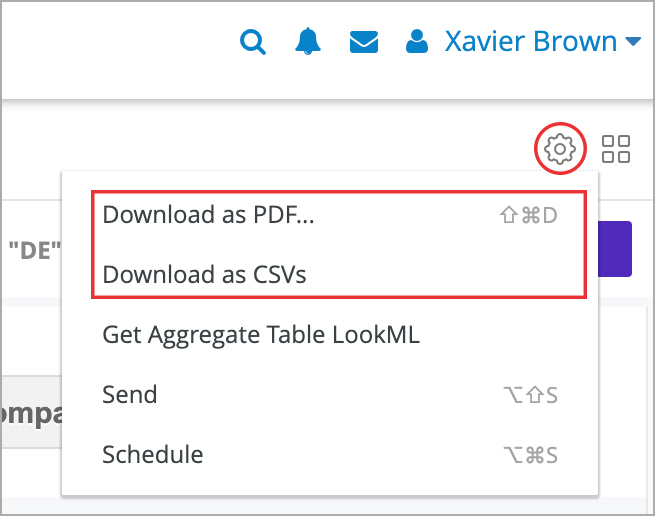
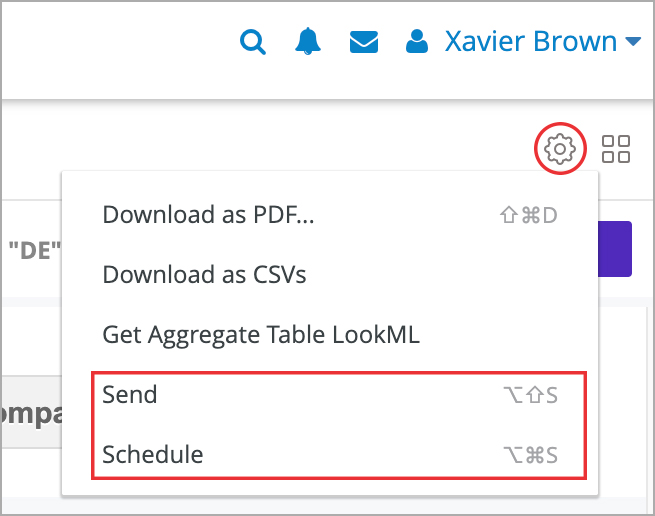
In the upper-right corner underneath your name, click the Gear icon to download the selected tab in either PDF or a CSV collection.
You have to click each tab in the Contractor Scorecard to download the data on each tab.
Saving a Dashboard as a PDF
Interactive PDF files include work order links that, when clicked, navigate back to the Work Order Details in Service Automation. Also, tables in a PDF can be expanded to see all data rows, not just the rows that are visible in the dashboard.
- On the desired dashboard (or dashboard tab), click the Gear icon in the upper-right of the page, and then click Download as PDF. The Download modal appears.
A default Filename appears, but you can change it.
Under Advanced options:
Single-column format lays out all tables and visualizations on a page into one column in the PDF, as opposed to how it is laid out in the dashboard.
- Expand tables shows all rows in a table, instead of just the rows that appear on the dashboard.
- Paper size adjusts the PDF to your desired size.
- Click Open in Browser to view the PDF in your chosen browser, or click Download to save a version of the report onto your device.
Saving a Dashboard in a CSV Zip File
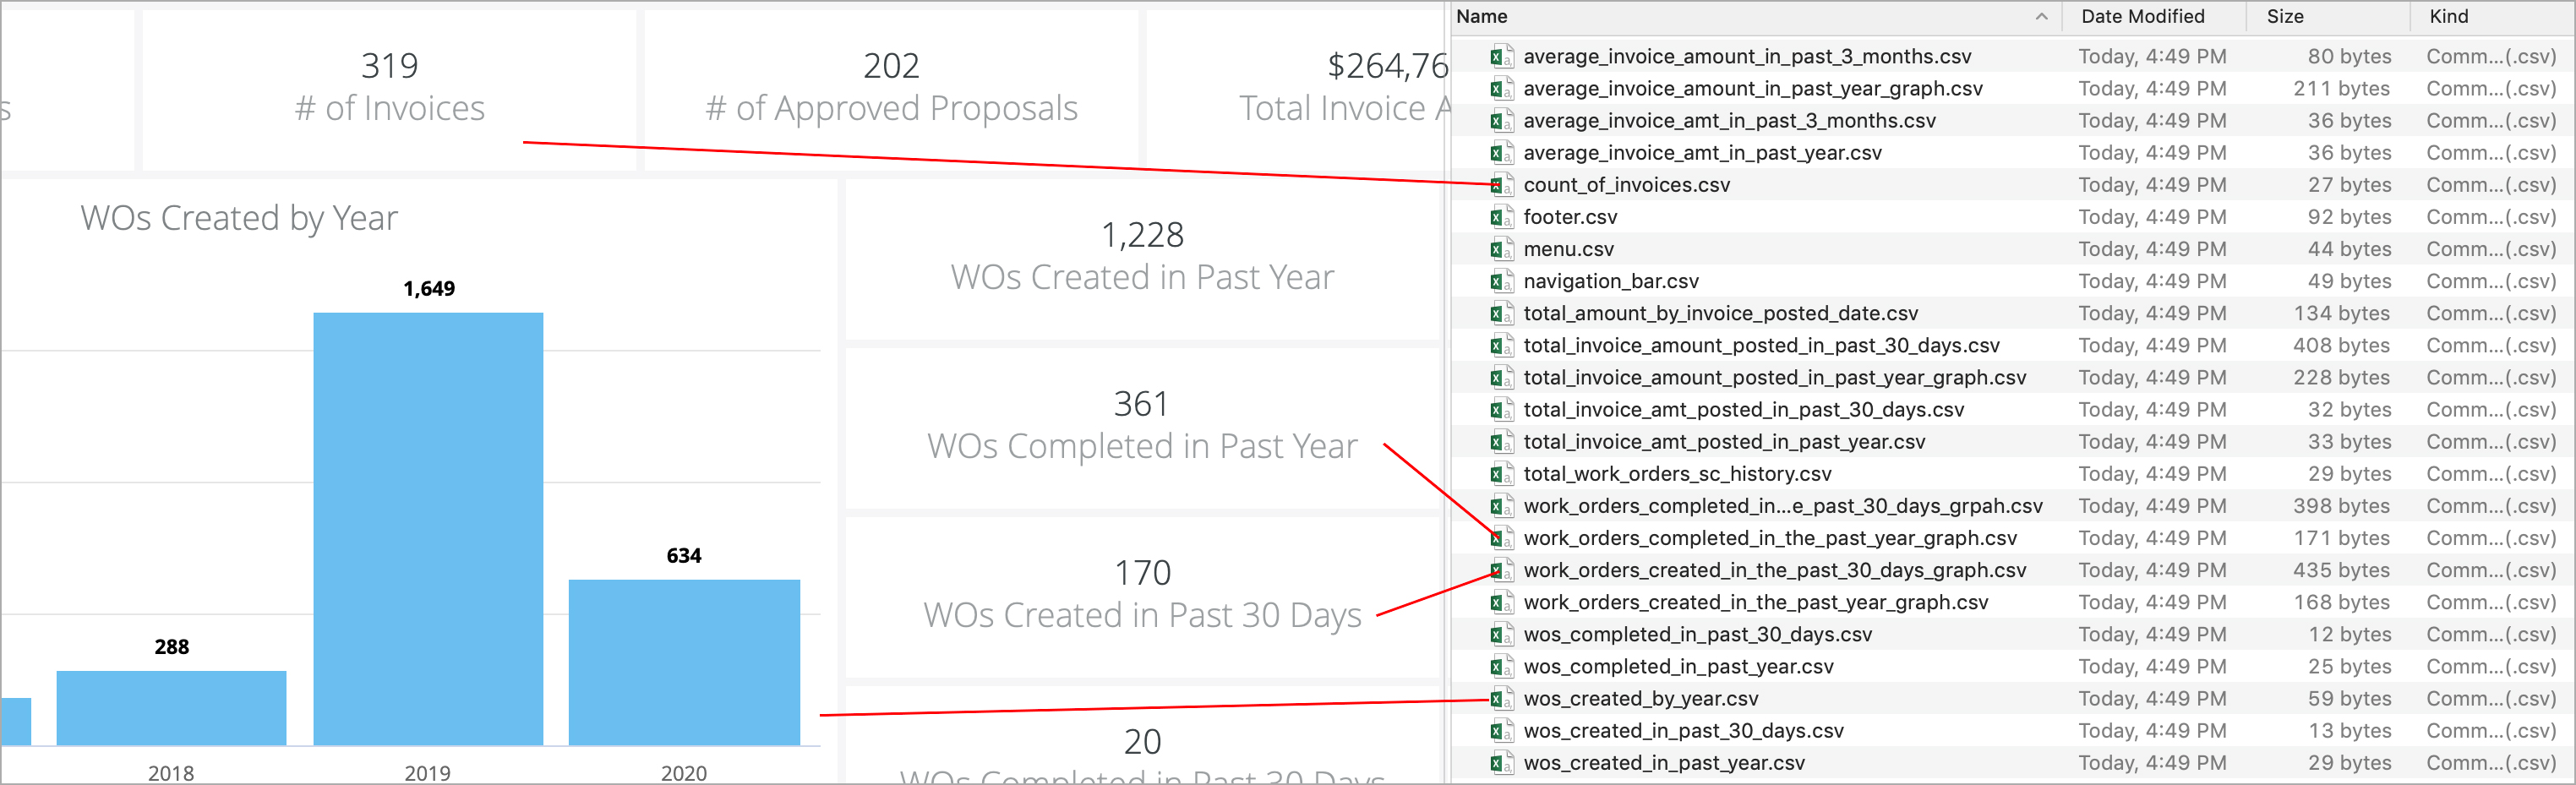
For every table and visualization on a dashboard, a CSV file is created that includes the raw data of the file.
This is an example of the Insite - Program Overview dashboard. Every tile on the dashboard is exported as its own CSV file. The more visualizations on a dashboard, the more CSV files will download.
- On the desired dashboard (or dashboard tab), click the Gear icon in the upper-right of the page, and then click Download as CSVs... A new browser tab opens.
- After the files render, you are prompted to save the CSV Zip file onto your device.
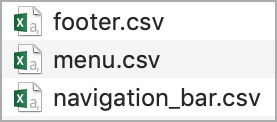
Three files can be removed from the export: footer.csv, menu.csv, and navigation_bar.csv, as these related to Analytics navigation and page layout.
Sending Reports and Data to Email Recipients
Sending a One-Time Report via Email
Use the Send option to manually email your current dashboard or visualization view to email recipients.
From here, you can choose your delivery method, destination, and format, as well as advanced options such as filters and expanded tables.
Should you need to send a report with expanded tables, you can find that option under Advanced Options.
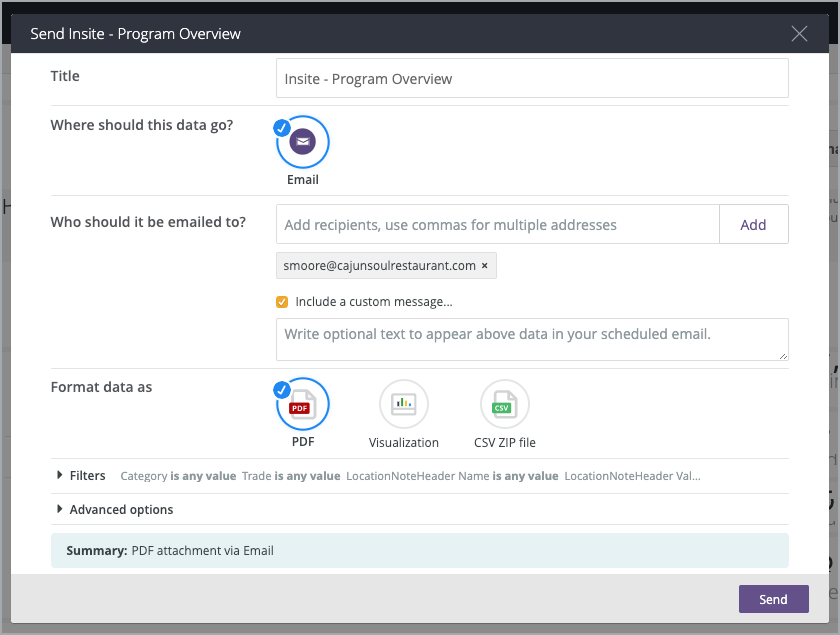
- On the desired dashboard (or dashboard tab), click the Gear icon in the upper-right of the page, and then click Send. The Send (Dashboard Name) modal opens.
- A Title is given by default, but you can change it.
- Under Who should it be emailed to?, enter the desired recipient(s), separated by a comma, and then click Add.
- (Optional) Click Include a custom message to add a personal note.
- Under Format data as, choose PDF, Visualization, or CSV Zip file.
- (Optional): Click Filters to limit the criteria that appear in the email. Note that the same filters on the dashboard itself will also appear here.
- (Optional): Click Advanced Options for more dynamic controls.
- Email Options:
- Check Run schedule as recipient to send the report with the data they would see as if they ran the query themselves. In other words, if you have a District Manager with access to 2 locations in 1 district, but your report covers 5 locations across 20 districts, the recipient will receive a report with only their 2 locations in that district. Each user's user attributes and system access controls what recipients see when this box is checked.
- Include links is checked by default, as this allows users to click work order links and navigate straight to Service Automation.
- Format Options:
- (CSVs) Apply visualization options is checked by default, as this allows the data to download the way it appears on the dashboard. In other words, chart builders may have changed the names of column headers, chart legends, or X and Y graph labels to make the data easy to view in the dashboard. Keeping this option checked retains that view.
- To view the Dimensions and Measures used to build the chart, change this setting to As displayed in the data table.
- (CSVs) Formatted data values is checked by default, which leaves the data intact with relative decimals, percentages, commas, and the like. To change to an unformatted, raw data format, uncheck this box.
- Email Options:
Click Send. The email is sent to your recipients.
Scheduling a Recurring Report
Scheduling a Report is the same as sending a manual report except that you can set the intervals at which recipients should receive the reports. You can set up a scheduled report on the same dashboard that you are currently viewing.
You can also modify and delete scheduled reports.
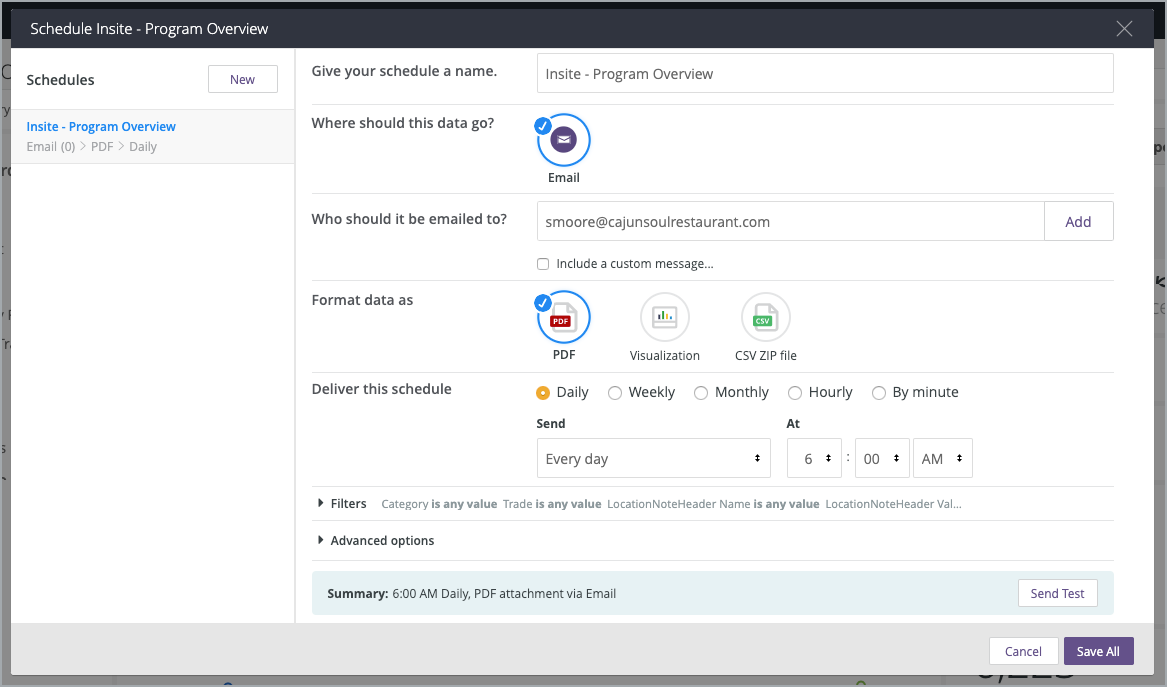
- On the desired dashboard (or dashboard tab), click the Gear icon in the upper-right of the page, and then click Schedule. The Schedule (Dashboard Name) modal opens.
- A Title is given by default, but you can change it.
- Under Who should it be emailed to?, enter the desired recipient(s), separated by a comma, and then click Add.
- (Optional) Click Include a custom message to add a personal note.
- Under Format data as, choose PDF, Visualization, or CSV Zip file.
- Under Deliver this schedule, choose
- Daily: Every day, Weekdays only, or on specific days, at the time you specify.
- Weekly: The same day of the week at the time you specify.
- Monthly: On the same date of every month, at the beginning of the quarter (Jan 1, Apr 1, July 1, and Oct 1), or during specific months, at the time you specify.
- Hourly: Every 1, 2, 3, 4, 6, 8, or 12 hours, at x minutes past the hour, between the hours you specify.
- By minute: In 5-minute increments, up to 30 minutes, between the hours you specify
- (Optional): Use Filters to limit the criteria that appear in the email. Note that the same filters on the dashboard itself will also appear here.
- (Optional): Use Advanced Options to make the report even more dynamic.
- Email Options:
- Check Run schedule as recipient to send the report with the data they would see as if they ran the query themselves. In other words, if you have a District Manager with access to 2 locations in 1 district, but your report covers 5 locations across 20 districts, the recipient will receive a report with only their 2 locations in that district. Each user's user attributes and system access controls what recipients see when this box is checked.
- Include links is checked by default, as this allows users to click work order links and navigate straight to Service Automation.
- Format Options:
- (CSVs) Apply visualization options is checked by default, as this allows the data to download the way it appears on the dashboard. In other words, chart builders may have changed the names of column headers, chart legends, or X and Y graph labels to make the data easy to view in the dashboard. Keeping this option checked retains that view.
- To view the Dimensions and Measures used to build the chart, change this setting to As displayed in the data table.
- (CSVs) Formatted data values is checked by default, which leaves the data intact with relative decimals, percentages, commas, and the like. To change to an unformatted, raw data format, uncheck this box.
- Email Options:
Click Send. The email is sent to your recipients.
Modifying and Deleting a Scheduled Report
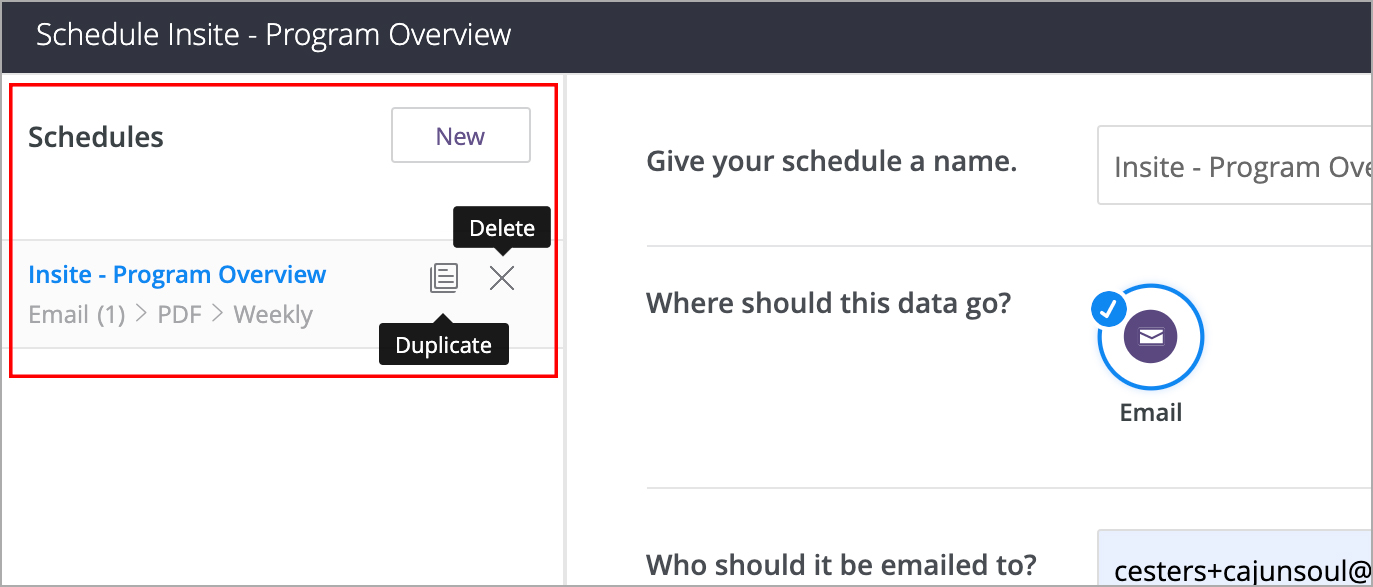
While on the same dashboard as the scheduled report, you can simply click the Gear Icon > Schedule to modify, duplicate, or delete a schedule, or add a new schedule using the same dashboard.
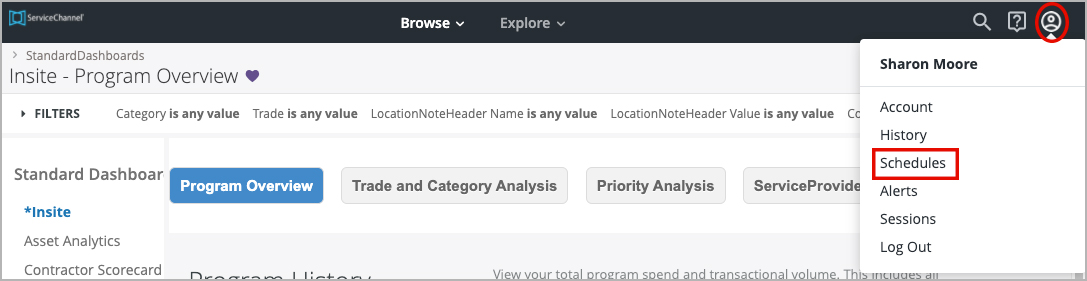
To see a list of all scheduled reports under all dashboards, click the profile icon > Schedules.
 From here you can
- view a list of scheduled reports, and then navigate to the associated dashboard to modify the report.
- delete scheduled reports.
In the upper-right corner of Analytics, click the profile icon > Schedules. The Schedules You've Created page appears.
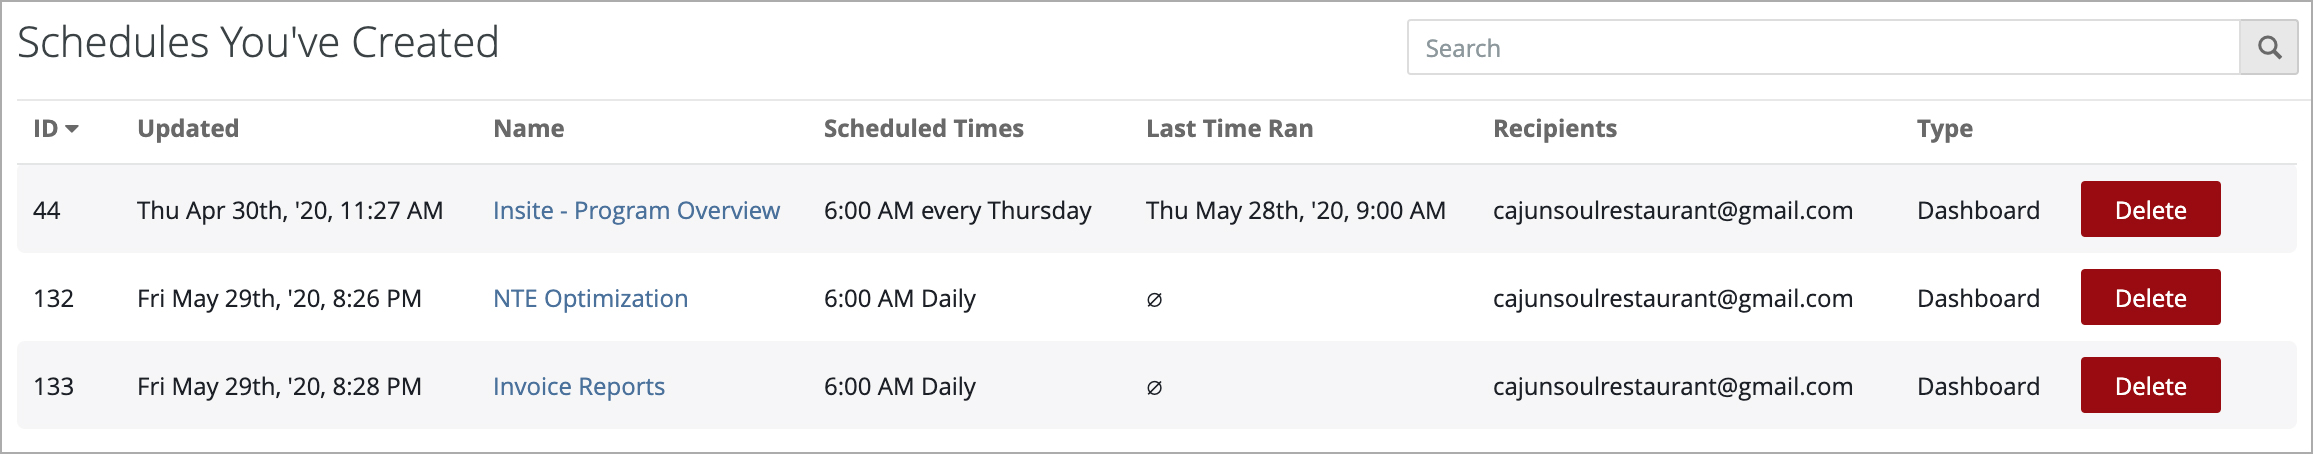
- To delete a schedule, click Delete to the right of the schedule.
To modify a schedule:
Locate the desired schedule and then click the schedule Name to go to that dashboard.
Click the Gear Icon > Schedule to modify or duplicate the schedule.
In the upper-right corner of Analytics, click the profile icon > Schedules.
- On the Schedules You've Created page, locate the desired schedule and then click the schedule Name to go to the dashboard.
Click the Gear Icon > Schedule to modify, duplicate, or delete the schedule.