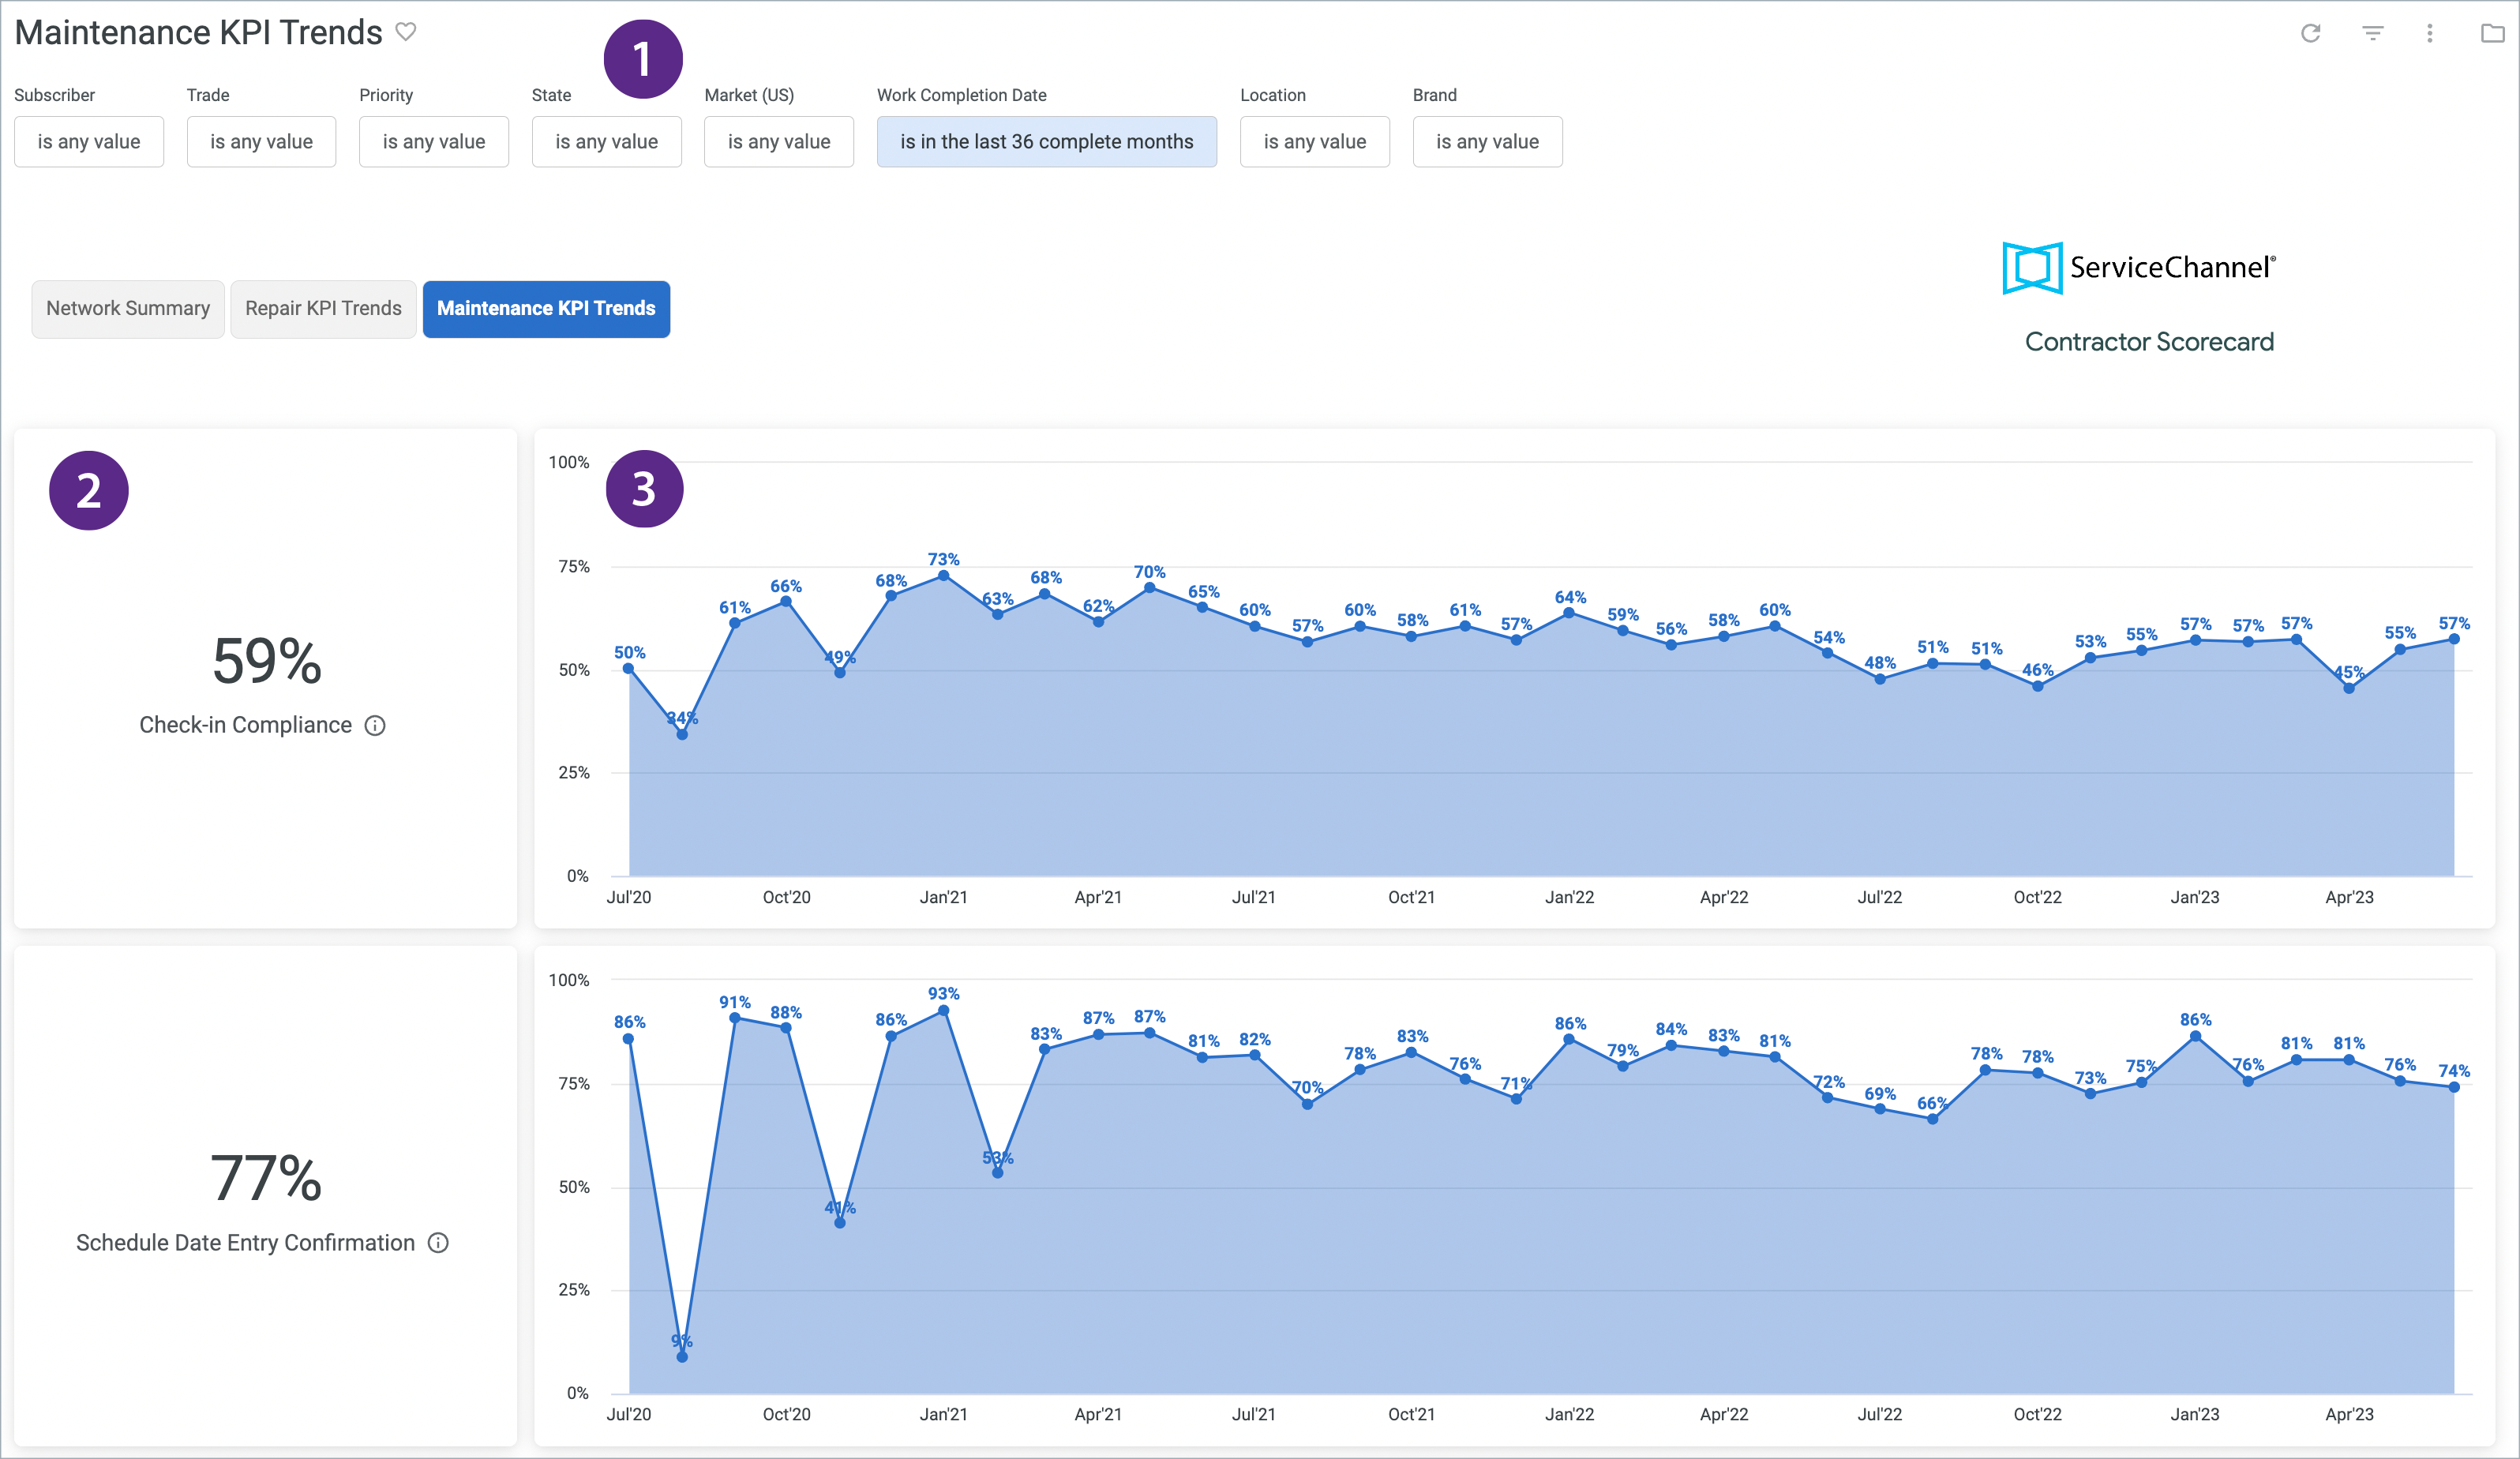
Maintenance KPI Trends Dashboard
- Caroline Antoun
Maintenance KPI Trends Dashboard in Contractor Scorecard shows how you are performing over a longer period of time on primary category maintenance work orders. The default setting is 36 months. The KPIs and calculations have remained the same, but we've given it a brand new look like the rest of Contractor Scorecard. View how you're trending across your entire client network or filter in to a trade, location, geographic area, or a specific subscriber(s).
Navigating the Maintenance KPI Trends Dashboard
Filters
Refine and deepen your insights by filtering for specific provider(s), priorities, trades, geographic area, date range, location, and brand/company name.

Subscriber: You can filter for a singular subscriber for a review or compare several subscribers.
Primary Trade: Search by one trade or several similar trades to get insight on trade specific performance.
Primary Priority: Look at scores associated with work orders of the same priority.
State: View providers by state(s).
Market (US): Search for providers in Core Based Statistical Areas (CBSA). CBSAs are geographic regions defined by the US Office of Management and Budget that are anchored around urban centers of 10,000+ people along with adjacent counties that have strong social and economic ties to the urban center. This allows you to get a true comparison of provider performance, particularly around cost and speed, as the environment is more similar in that area. For example, if you compared cost for providers in Dallas, TX, you get a more accurate picture comparing them amongst each other than if you compared Dallas providers to Fredericksburg, TX providers.
Work Completion Date: Default state is 36 complete months. You can filter to whatever date range suits your purpose. You can not go beyond 36 months.
Location: Filter for work performed at certain locations.
- Brand: Filter for certain brands in your portfolio.
Score and Trendline
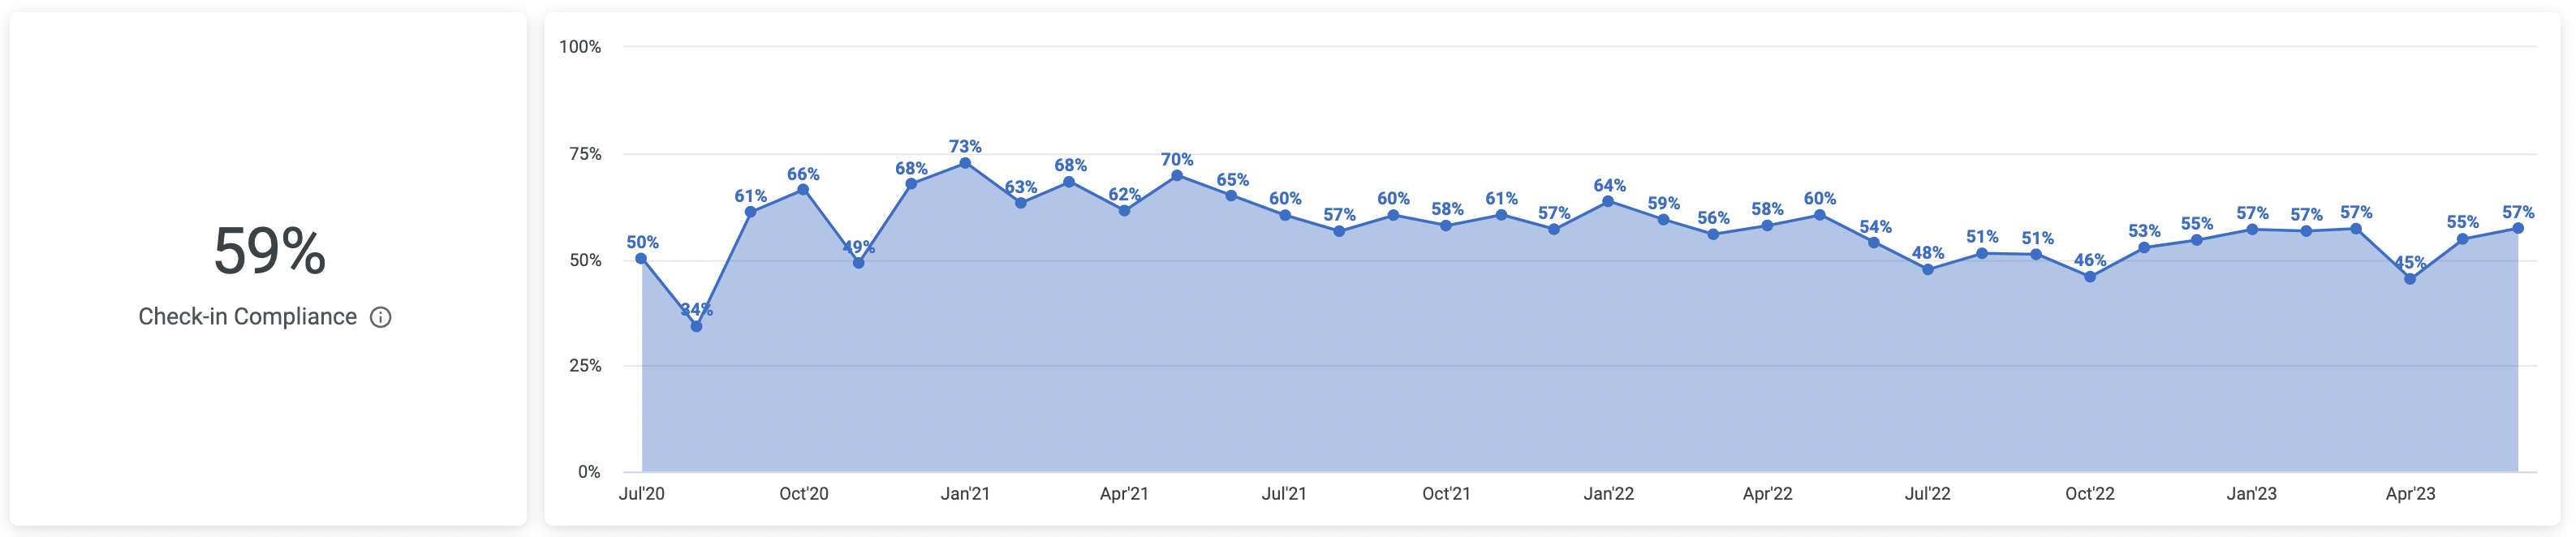
Score
- Click on the score, on the KPI you would like to drill into, and a window will pop up.
- Choose from:
- All - Shows both Compliant and Non-Compliant work orders
- Compliant - Shows only Compliant work orders
- Non-Compliant - Shows only Non-Compliant work orders.
Trendline
- Click on the data point on the trendline you would like to drill into and a window will pop up.
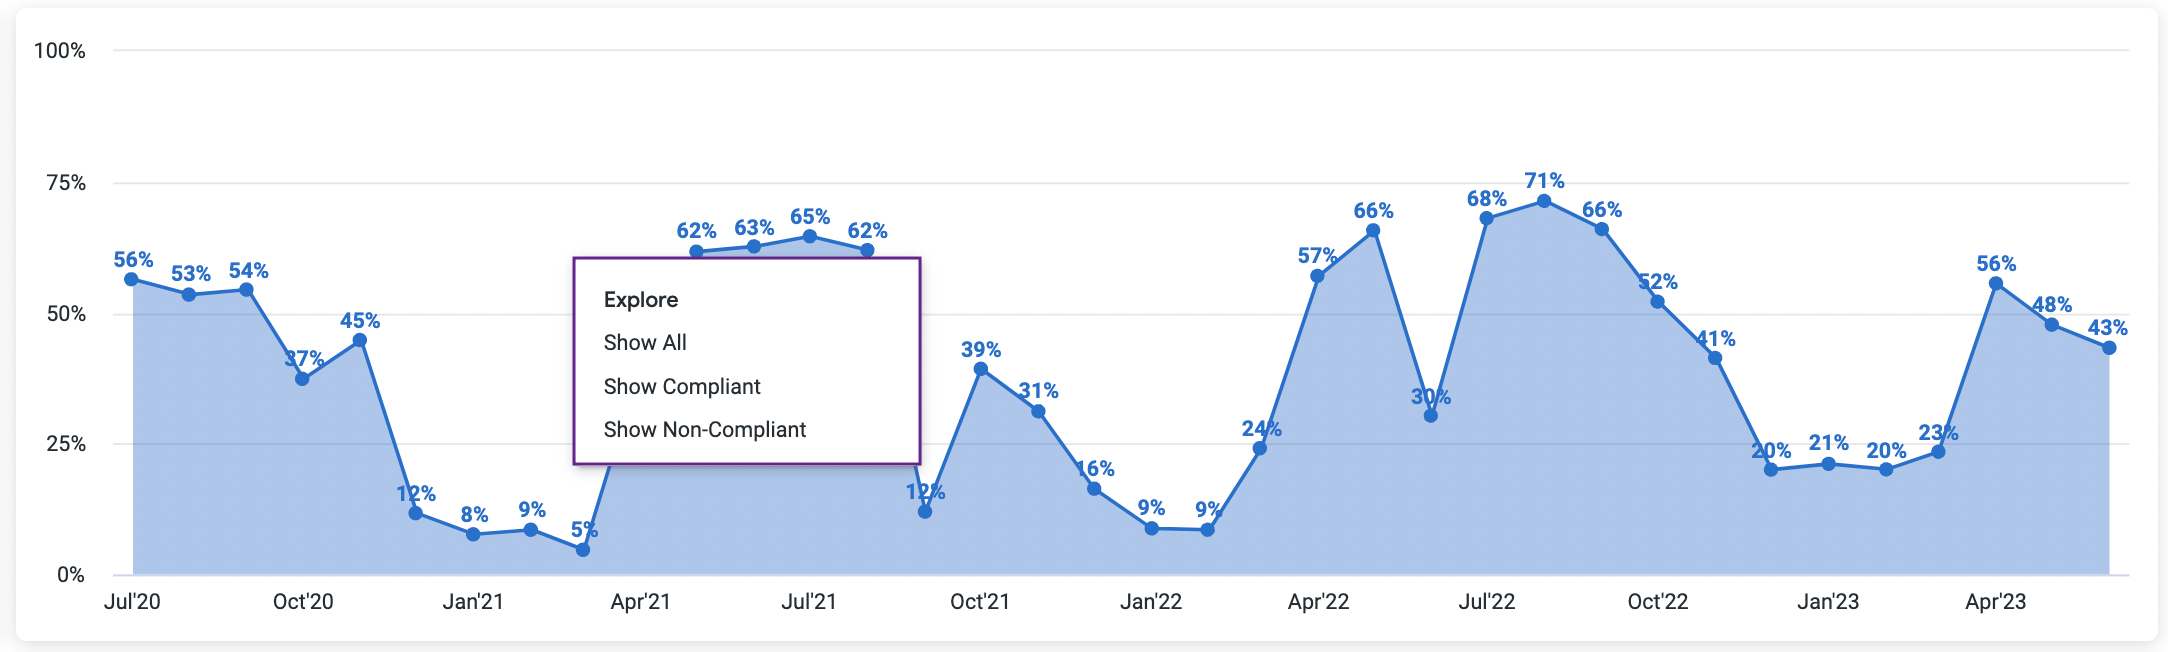
- Choose from:
- All - Shows both Compliant and Non-Compliant work orders
- Compliant - Shows only Compliant work orders
- Non-Compliant - Shows only Non-Compliant work orders.
Maintenance Score Calculations
| KPI | Definition | How it's Scored |
|---|---|---|
| Check-in Compliance | Percentage of completed work orders that have both a check-in and a check-out entry, with a minimum check-in time of 10 minutes. | # of Compliant Work Orders / Total Work Orders. Ex: 70 Compliant Work Orders / 100 total work orders = 70% Score |
| Schedule Date Entry Confirmation | Percentage of work orders where the scheduled date was updated by the service provider to indicate when the work will be performed (applicable only to Planned Maintenance work orders generated in bulk and with an expiration date). | # of Compliant Work Orders / Total Work Orders. Ex: 70 Compliant Work Orders / 100 total work orders = 70% Score |
| Scheduled Work Orders Completed | Percentage of work orders that were completed by the service provider before the expiration date of the work order. | # of Compliant Work Orders / Total Work Orders. Ex: 70 Compliant Work Orders / 100 total work orders = 70% Score |
| Overall Score | Sum of all KPI Scores divided by number of eligible KPIs. | Check in Compliance Score + Schedule Date Entry Confirmation Score + Scheduled Work Orders Completed Score / 3 = % Overall Score |

