Repair KPI Trends Dashboard
- Caroline Antoun
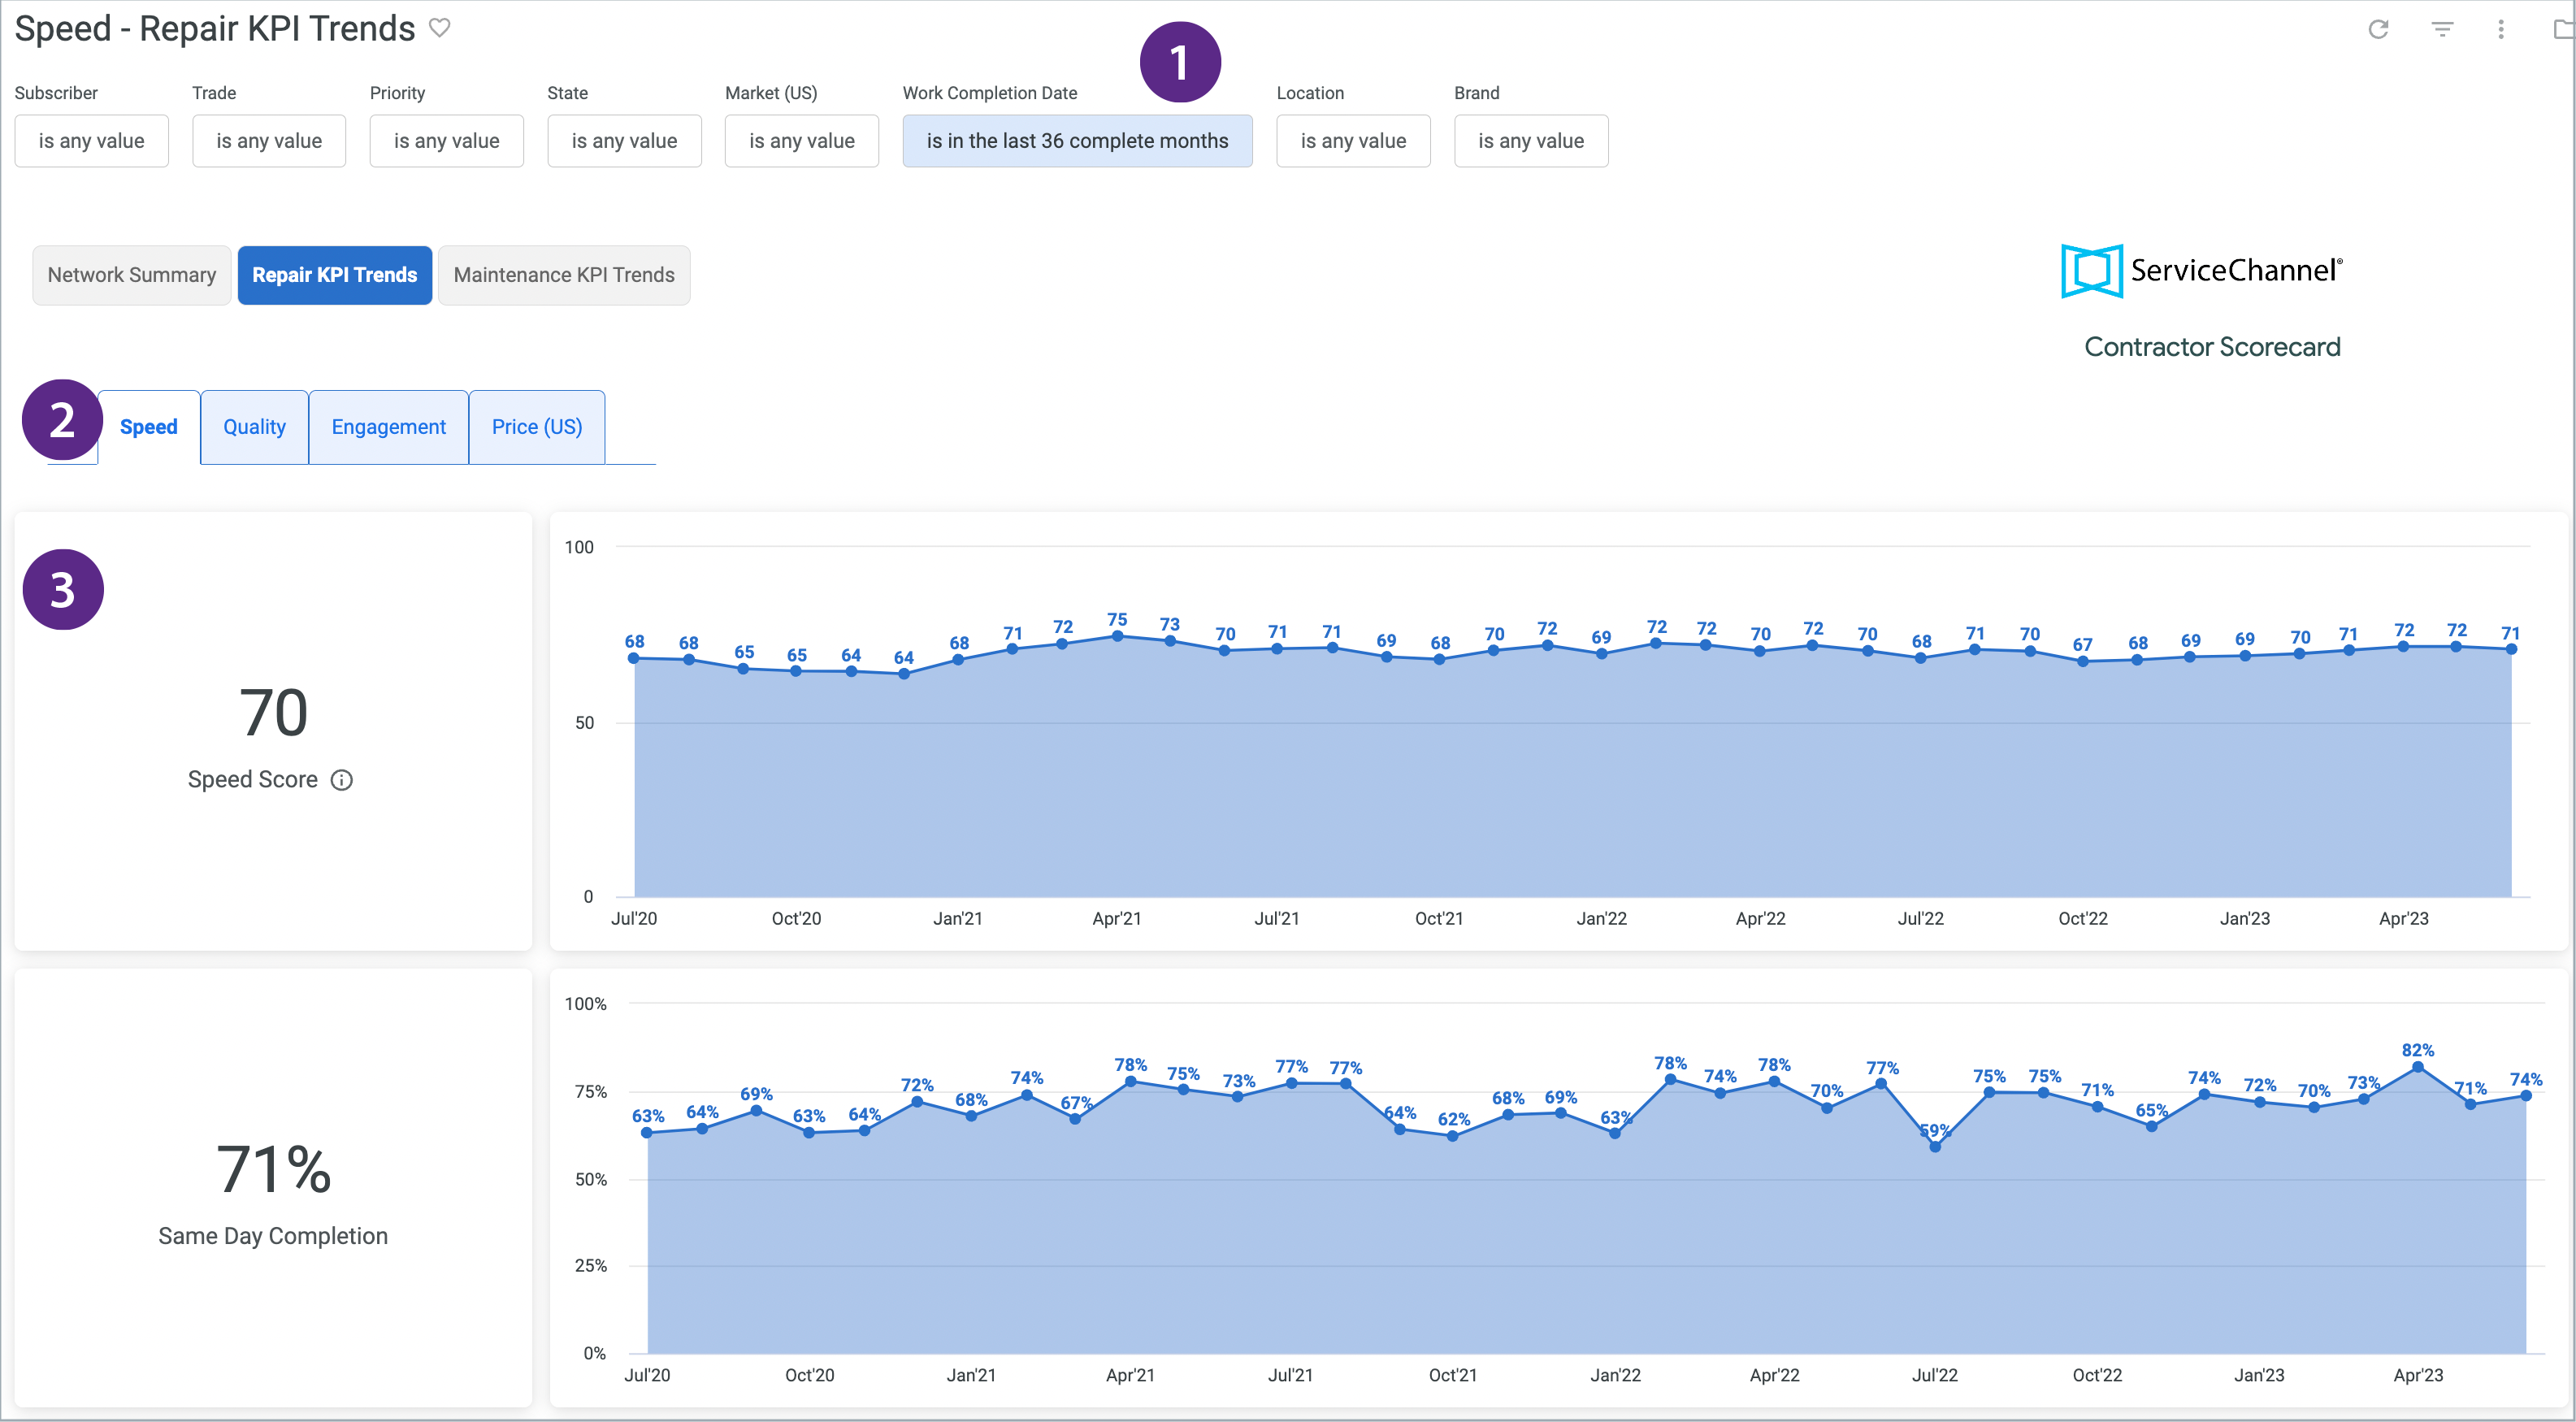
Repair KPI Trends Dashboard in Contractor Scorecard shows how you are performing over a longer period of time in each performance category in repair work orders*. The default setting is 36 months. View how you are trending across your entire client network or filter in to a trade or a specific subscriber(s).
* Engagement does not have repair work orders associated with its score as it is based on Fixxbook activities.
Navigating the Repair KPI Trends Dashboard
- Filters - Filters will change with every tab to only include the most relevant information for each type of report and help you filter for the most meaningful data. Pay attention as some look similar, but actually do have filters different from previous pages.
- Performance Category Tabs - Click on each tab to get a deeper look at each performance category.
- Speed specific look at 9 speed KPIs based on repair work orders.
- Quality specific look at 4 quality KPIs based on repair work orders.
- Engagement specific look at 6 engagement KPIs based on Fixxbook activities.
- Price (US) specific look at 6 price KPIs based on median invoice amounts.
- Scores and Trendlines - View each KPI score and trendline for the last 36 months of data for each category and KPI. For Speed and Quality, you can drill into each data point on the trendline.
Speed & Quality
Both Speed and Quality scores and trendlines have the same filters and drill in capabilities.
Filters

Refine and deepen your insights by filtering for specific provider(s), priorities, trades, geographic area, date range, location, and brand/company name.
Subscriber: You can filter for a singular subscriber for a review or compare several subscribers.
Primary Trade: Search by one trade or several similar trades to get insight on trade specific performance.
Primary Priority: Look at scores associated with work orders of the same priority.
State: View providers by state(s).
Market (US): Search for providers in Core Based Statistical Areas (CBSA). CBSAs are geographic regions defined by the US Office of Management and Budget that are anchored around urban centers of 10,000+ people along with adjacent counties that have strong social and economic ties to the urban center. This allows you to get a true comparison of provider performance, particularly around cost and speed, as the environment is more similar in that area. For example, if you compared cost for providers in Dallas, TX, you get a more accurate picture comparing them amongst each other than if you compared Dallas providers to Fredericksburg, TX providers.
Work Completion Date: Default state is 36 complete months. You can filter to whatever date range suits your purpose. You can not go beyond 36 months.
Location: Filter for work performed at certain locations.
- Brand: Filter for certain brands in your portfolio.
Score and Trendline
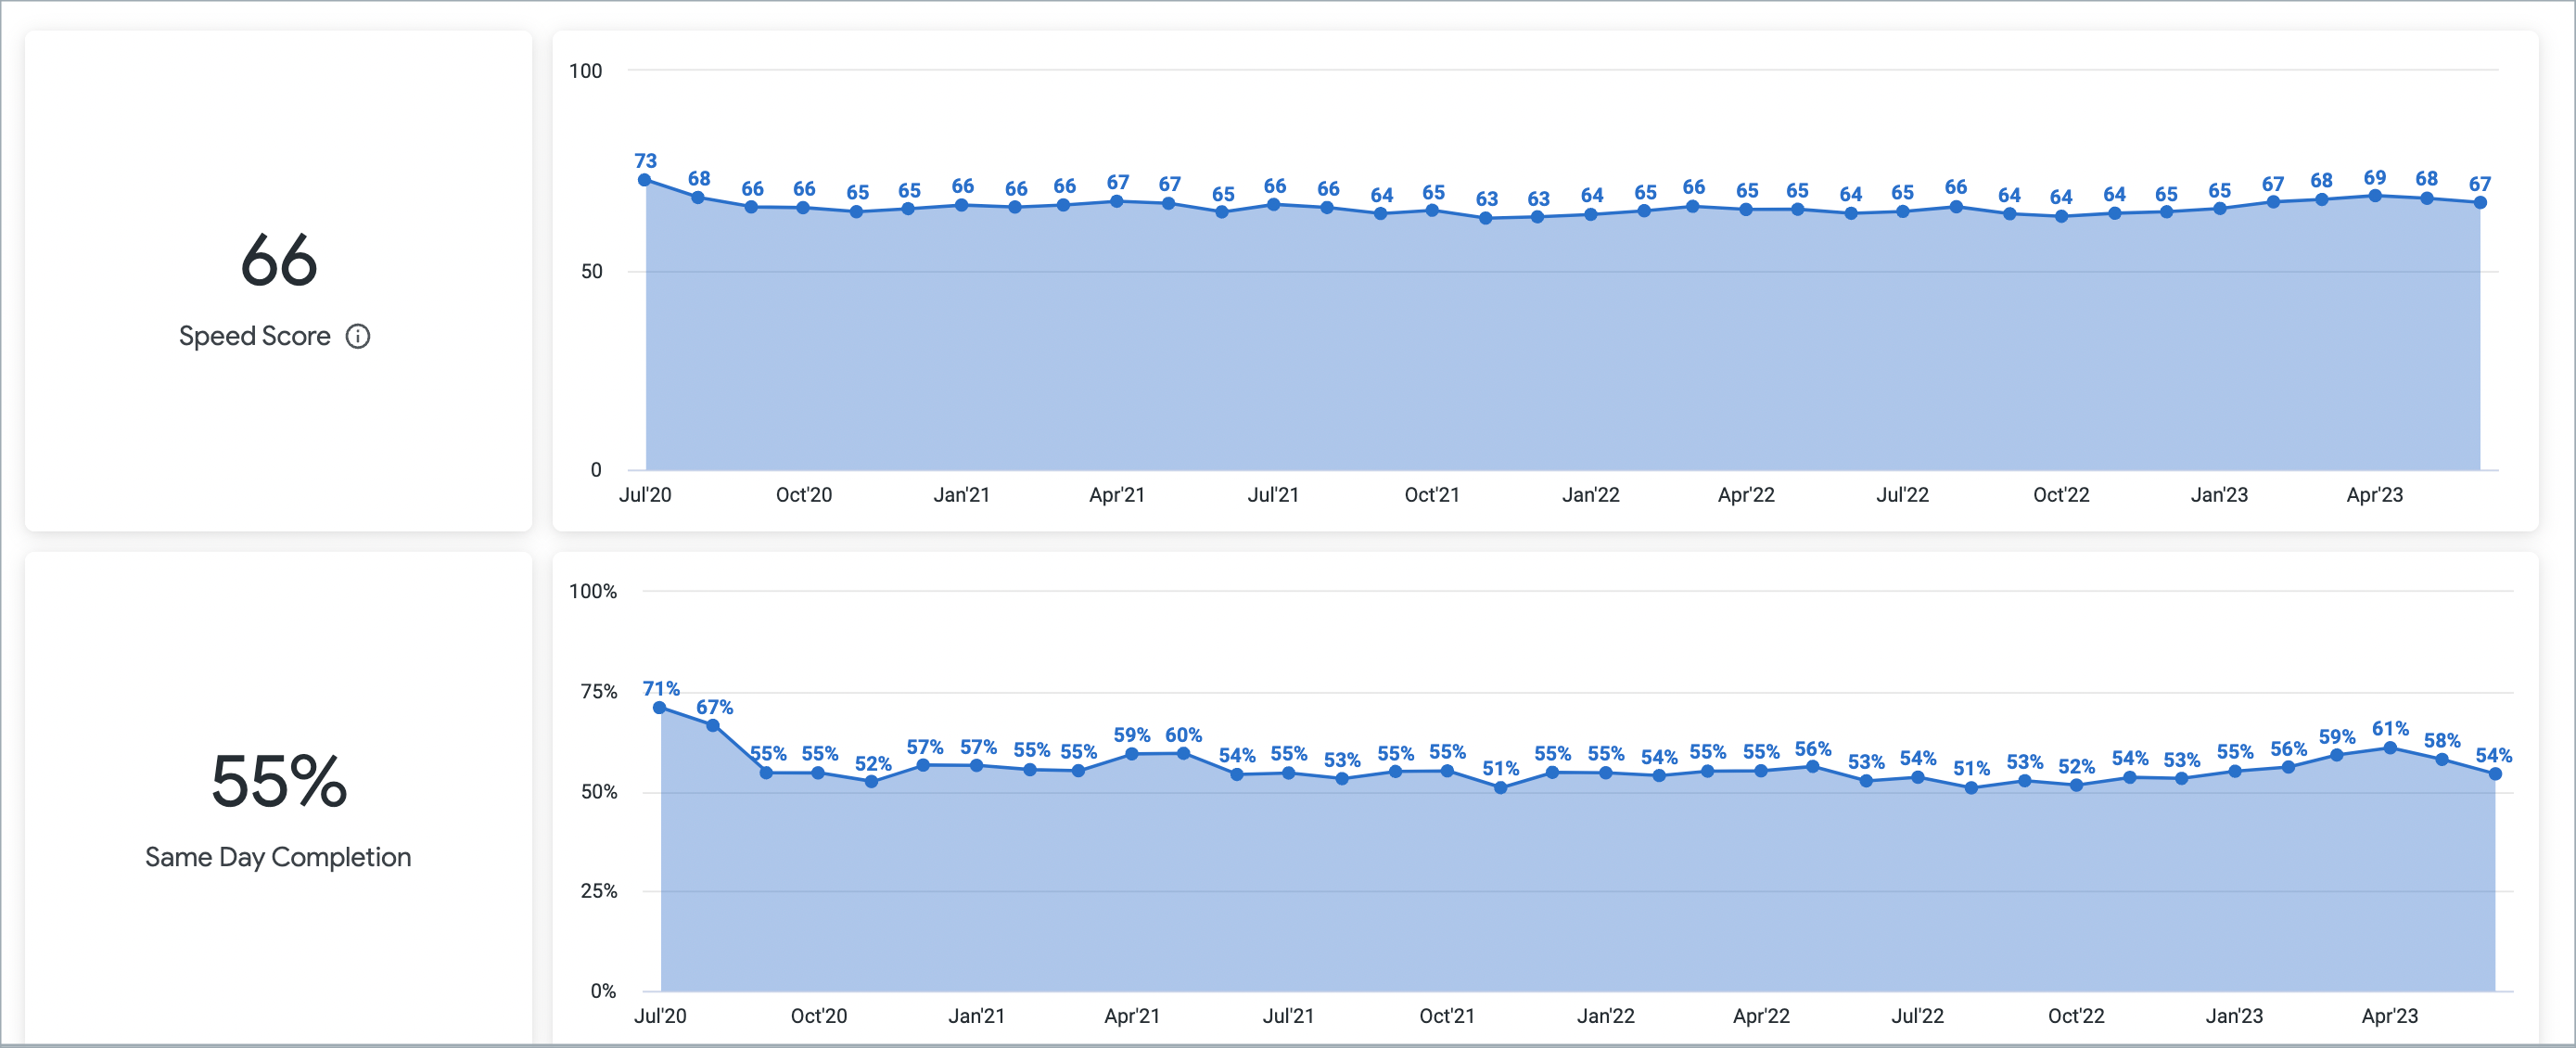
- Click on the overall score and a window will pop up.
- Click Show All.
- Click on the score on the KPI you would like to drill into and a window will pop up.
- Choose from:
- All - Shows both Compliant and Non-Compliant work orders
- Compliant - Shows only Compliant work orders
- Non-Compliant - Shows only Non-Compliant work orders.
To view Speed Score Calculations, jump on over to Contractor Scorecard Calculations. To view Quality Score Calculations, jump on over to Contractor Scorecard Calculations.
Engagement
Engagement scores are based on Fixxbook activity and is calculated on the first Sunday of each month.
Filters
There are no filters for engagement as the score is solely based on your Fixxbook activity and not work order reliant.
Score and Trendline
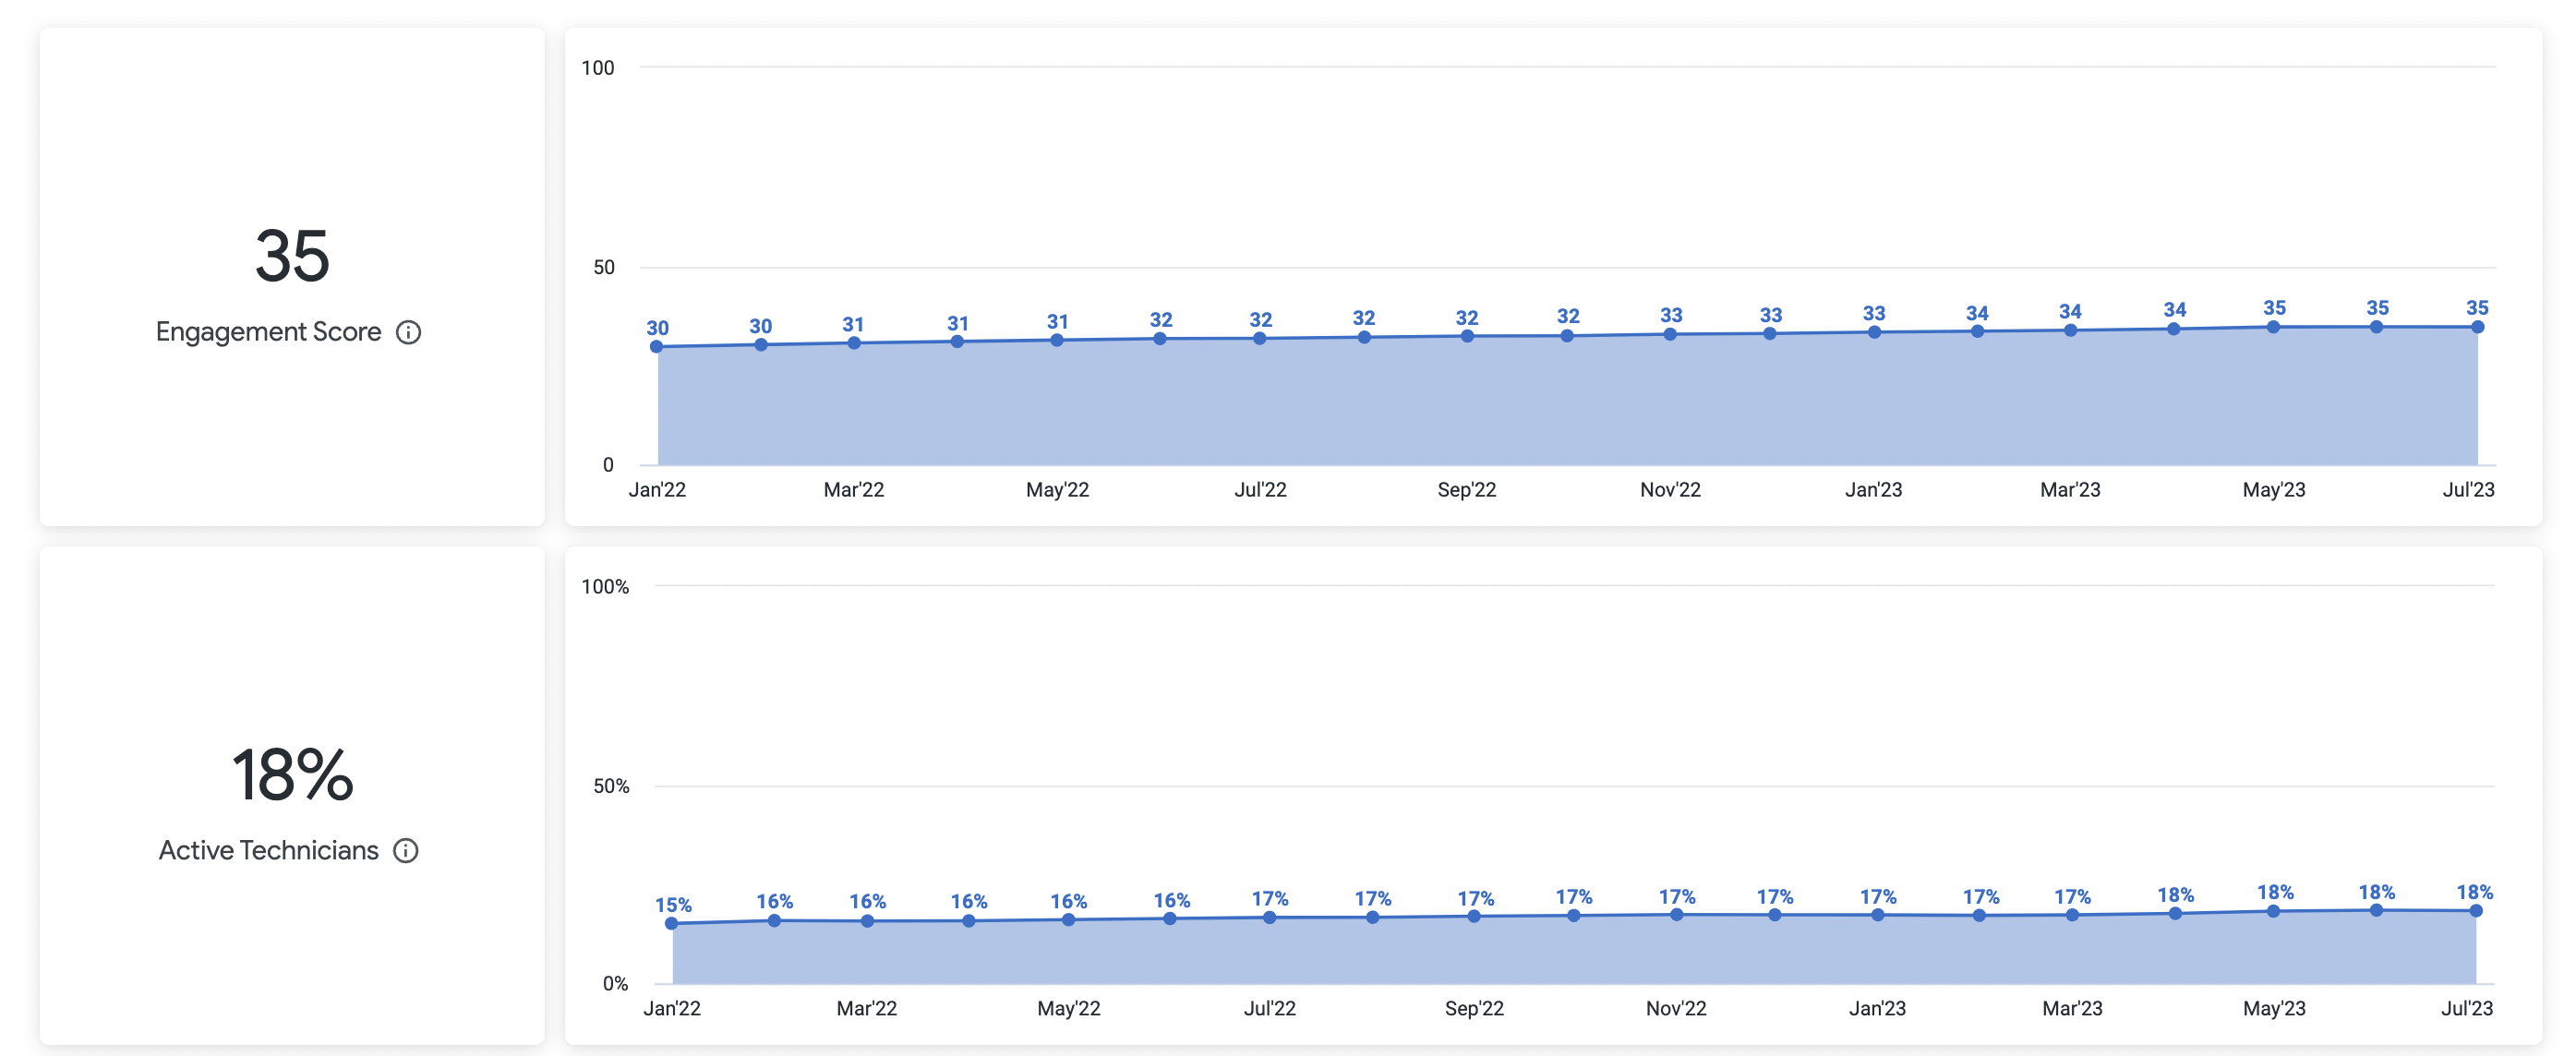
No Drill In
This look does not have drill in capabilities as the score is an aggregate of various activities. If you are clicking and nothing is happening, that is how it is supposed to function!
To view Engagement Score Calculations, jump on over to Contractor Scorecard Calculations.
Price (US)
Price scores are dynamic and comparative, and heavily reliant upon current marketplace data in the same trade and CBSA in order to be the most relevant.
Filters

- Subscriber: You can filter for a singular subscriber for a review or compare several subscribers.
Primary Trade: Search by one trade or several similar trades to get insight on trade specific performance.
Primary Priority: Look at scores associated with work orders of the same priority.
Market (US): Search for providers in Core Based Statistical Areas (CBSA). CBSAs are geographic regions defined by the US Office of Management and Budget that are anchored around urban centers of 10,000+ people along with adjacent counties that have strong social and economic ties to the urban center. This allows you to get a true comparison of provider performance, particularly around cost and speed, as the environment is more similar in that area. For example, if you compared cost for providers in Dallas, TX, you get a more accurate picture comparing them amongst each other than if you compared Dallas providers to Fredericksburg, TX providers.
Score and Trendline
Price score trends begin from Dec '22 from its inception. Eventually, 36 complete months of rolling data will show on the trendline and be fixed.
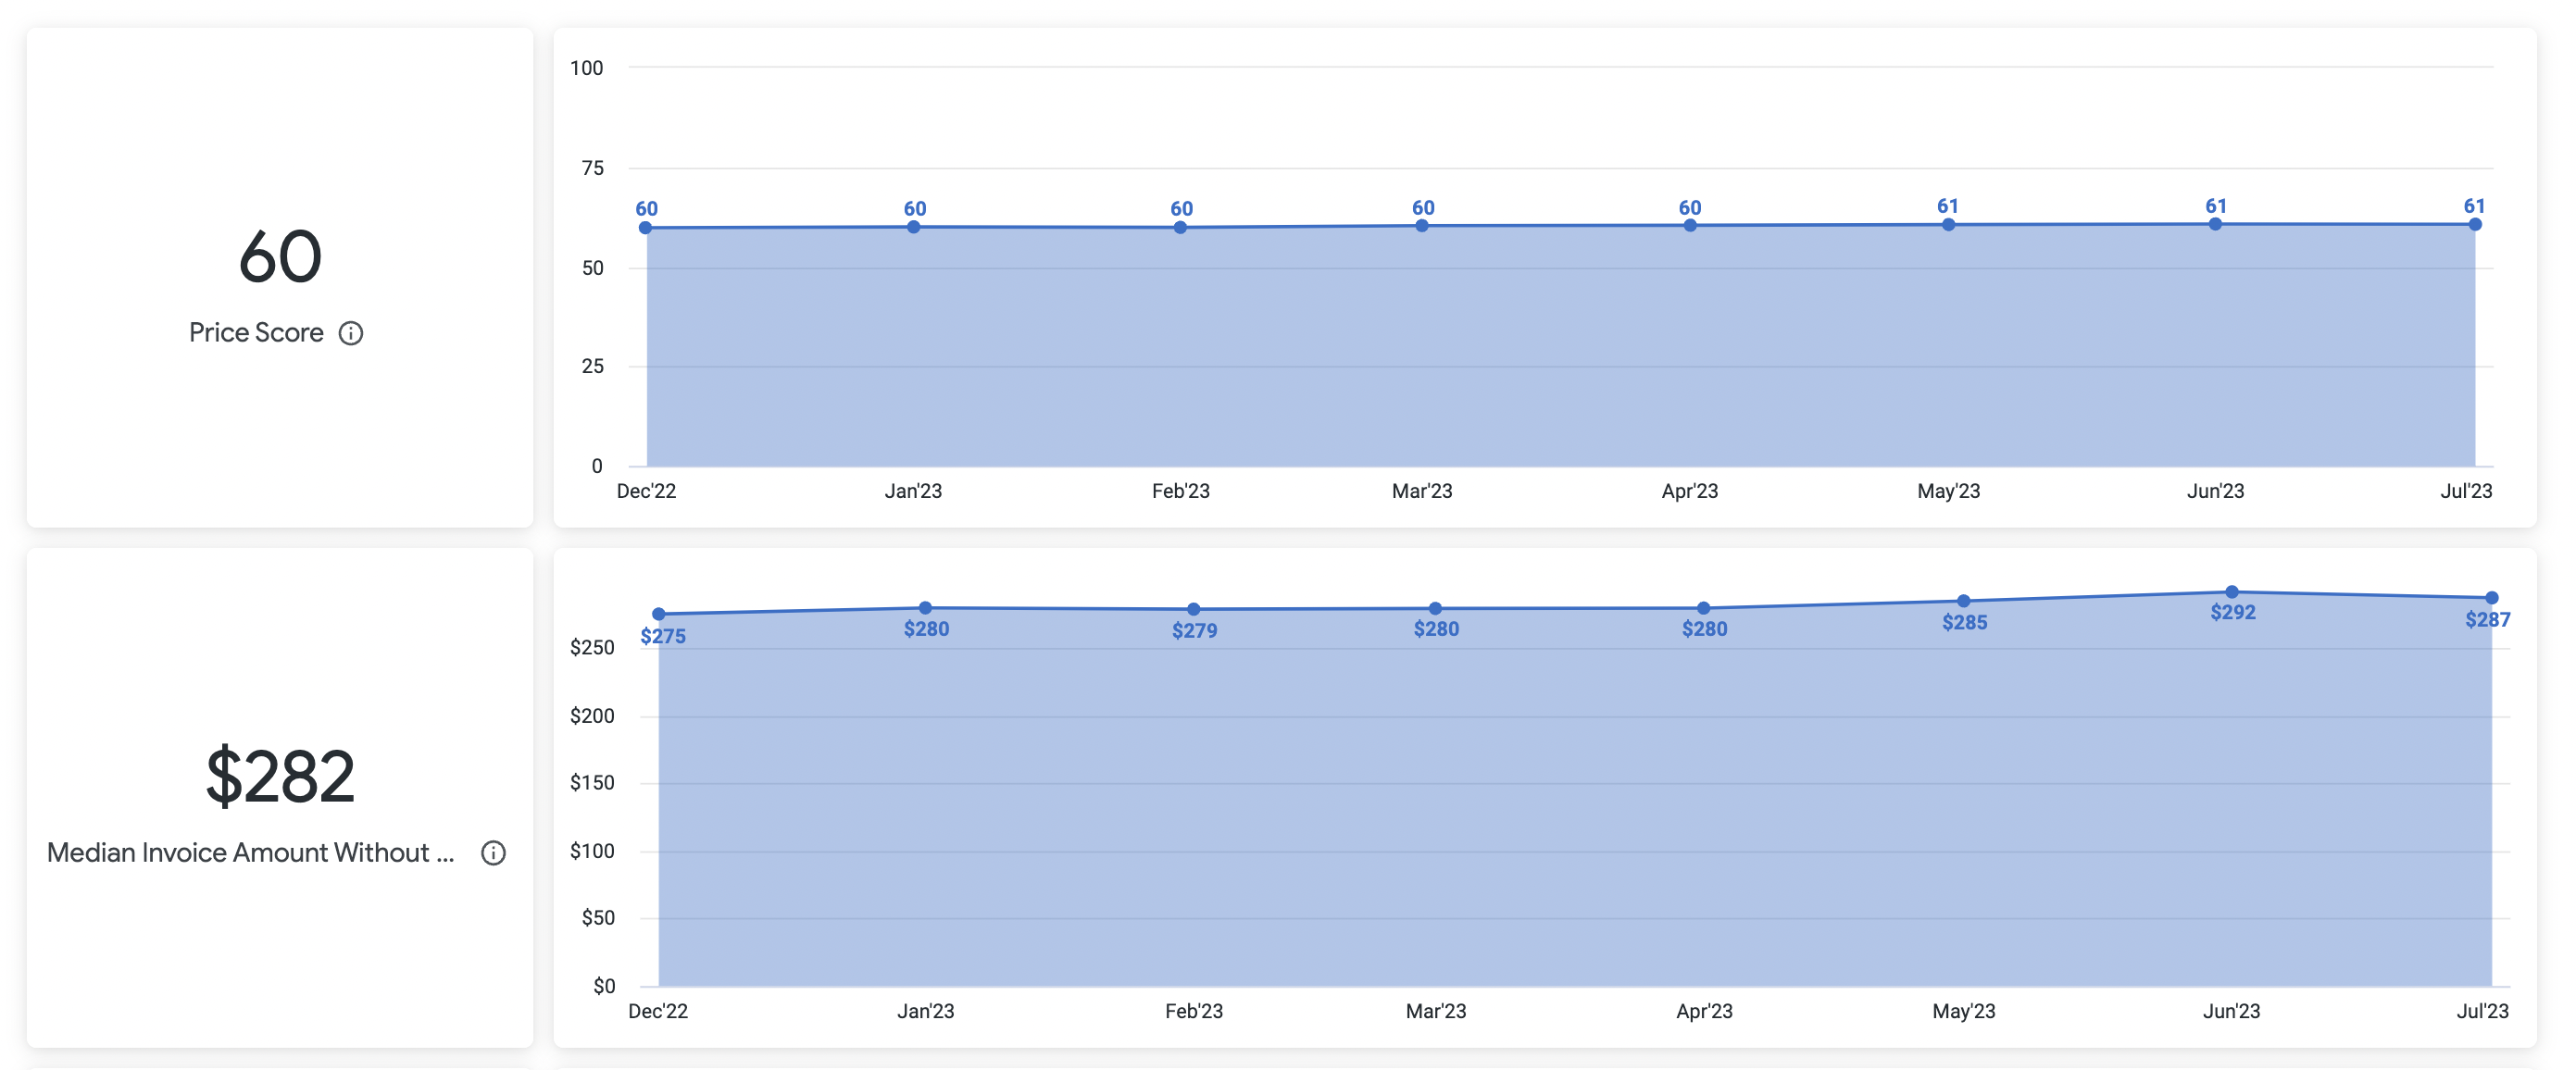
No Drill In
This look does not have drill in capabilities as there is not one singular factor to each KPI and overall score. If you are clicking and nothing is happening, that is how it is supposed to function!
To view Price Score Calculations, jump on over to Contractor Scorecard Calculations.

Commonly Used Features
Below is a quick reference guide regarding tracking numbers in the Scorecard, filtering, sorting, downloading data, and sending reports.
Tracking Numbers in Analytics
Throughout the Contractor Scorecard, you can drill down into visualizations to see the underlying data. In most cases, the tracking numbers related to that data are listed. You can click the tracking number to navigate straight to the work order details in Service Automation.
Filtering Dashboards
On top of the report are all-inclusive filters to help you hone in on key data. All reports on the page are affected by the criteria set in these all-inclusive filters.
The filter criteria for each dashboard may differ. Filters reset to the default when the page is refreshed.
Click the triangle next to Filters to show the criteria.

Select the desired criteria to include or exclude:
To Include criteria: select is equal to, contains, starts with, or ends with, and then begin typing the criteria in the picklist. Select the desired criteria (or multiple criteria) from the picklist.
To exclude criteria: select is not equal to, does not contain, does not start with, or does not end with.
Is null depicts the absence of data in a data set. Conversely, is not null depicts the presence of data
To include or exclude data without a certain data criteria — for example, to select data without a Region or District assigned in Service Automation — choose is blank / is not blank.
To add more options, click the plus sign (+) next to a field to add another option to the filter. The new option will appear as either an OR condition or an AND condition, depending on the type of filter option.
Once all criteria are selected, click Run in the top-right corner. The Dashboard report updates with the selected criteria.
More details are available on Filtering in the Contractor Scorecard.
Dynamic Table Sorting
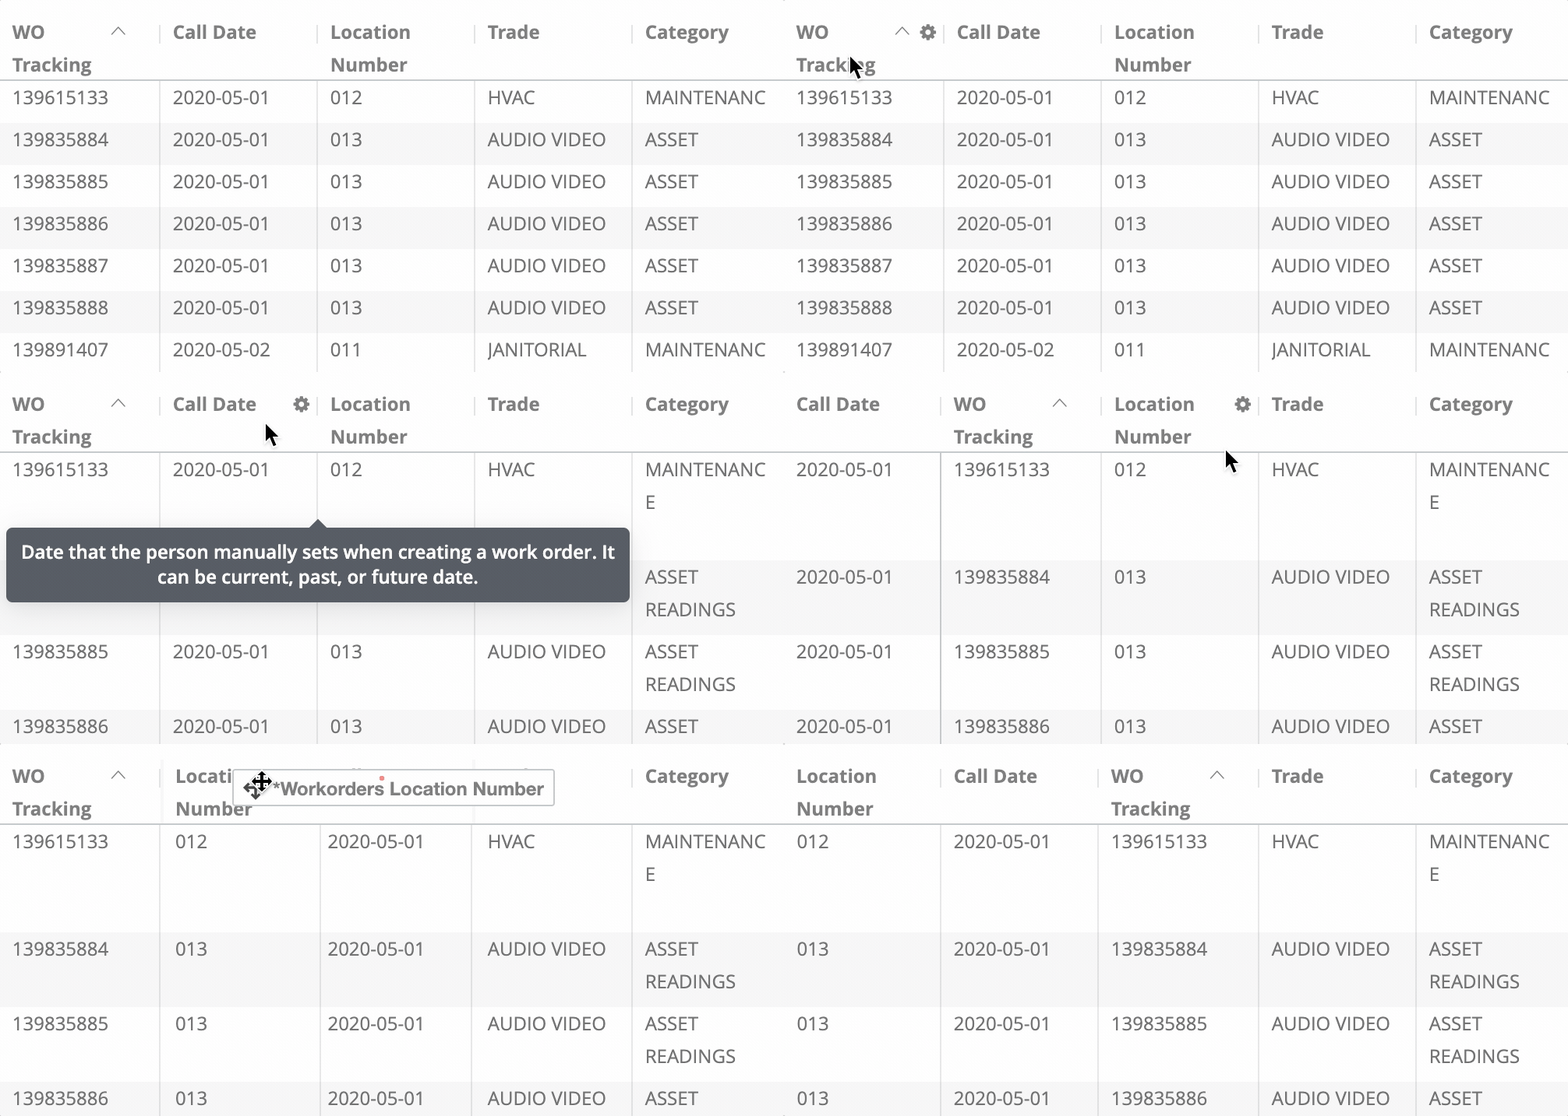
Analytics tables are dynamic, as you can:
- click column and row headers to sort data (the arrow indicate which data is sorted),
- hover over a header to show the gear icon where you can interact with the data more dynamically, and
- drag and drop a header to rearrange the table.
Downloading and Sending Reports
In the upper-right corner of any page, click the Gear icon to download reports, send reports, or schedule reports to send at regular intervals.
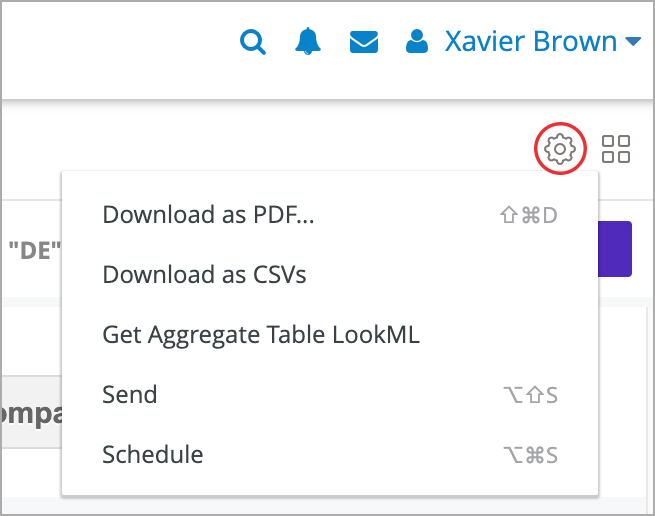
You can download data from a table and visualization or download a dashboard tabto PDF or CSV.
- On the desired table or visualization, hover over the upper-right to expose the 3 dots menu, and then click Download Data. The Download modal appears.
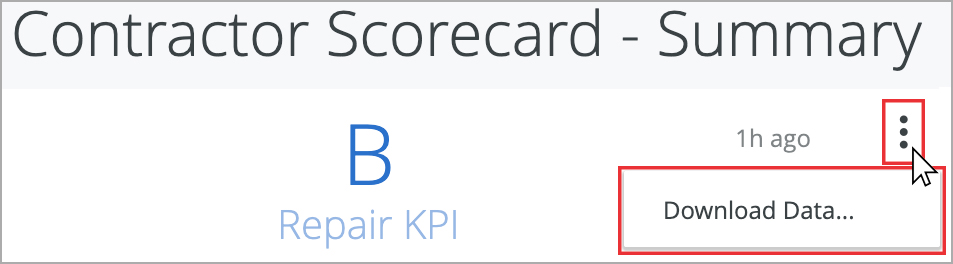
Select the desired File Format and choose a File Name: A default name is listed but you can change it.
- Click Download.
On the desired dashboard (or dashboard tab), click the Gear icon in the upper-right of the page, and then click Download as PDF. The Download modal appears.
A default Filename appears, but you can change it.
Under Advanced options:
Single-column format lays out all tables and visualizations on a page into one column in the PDF, as opposed to how it is laid out in the dashboard.
Expand tables shows all rows in a table, instead of just the rows that appear on the dashboard.
Paper size adjusts the PDF to your desired size.
Click Open in Browser to view the PDF in your chosen browser, or click Download to save a version of the report onto your device.
On the desired dashboard (or dashboard tab), click the Gear icon in the upper-right of the page, and then click Download as CSVs... A new browser tab opens.
After the files render, you are prompted to save the CSV Zip file onto your device.
More details are available on Downloading and Sending Dashboards and Reports
You can also Send a one-time report via email or Schedule a recurring email send.