Contractor Scorecard
Contractor Scorecard takes the essence of tried and true KPIs and revamped it with contemporary data science practices to give you better data points to meaningfully evaluate contractor performance across your network and enables more productive conversations on how to improve performance.
Scores align with what you can see on Provider Search and allow you to easily compare your current providers with other providers in the marketplace. If you are interested in finding additional high performing providers, check out Provider Search.
How Scores are Calculated
Contractor Scores are calculated using data science techniques to provide the most statically significant and accurate scores that ServiceChannel can provide. To view performance category score calculations, jump on over to Contractor Scorecard Calculations. To view maintenance scores, jump on over to Maintenance KPI Trends.
Navigating Contractor Scorecard
Filters
Filters will change with every tab to only include the most relevant information for each type of report and help you filter for the most meaningful data. Pay attention as some look similar, but actually do have filters different from previous pages.
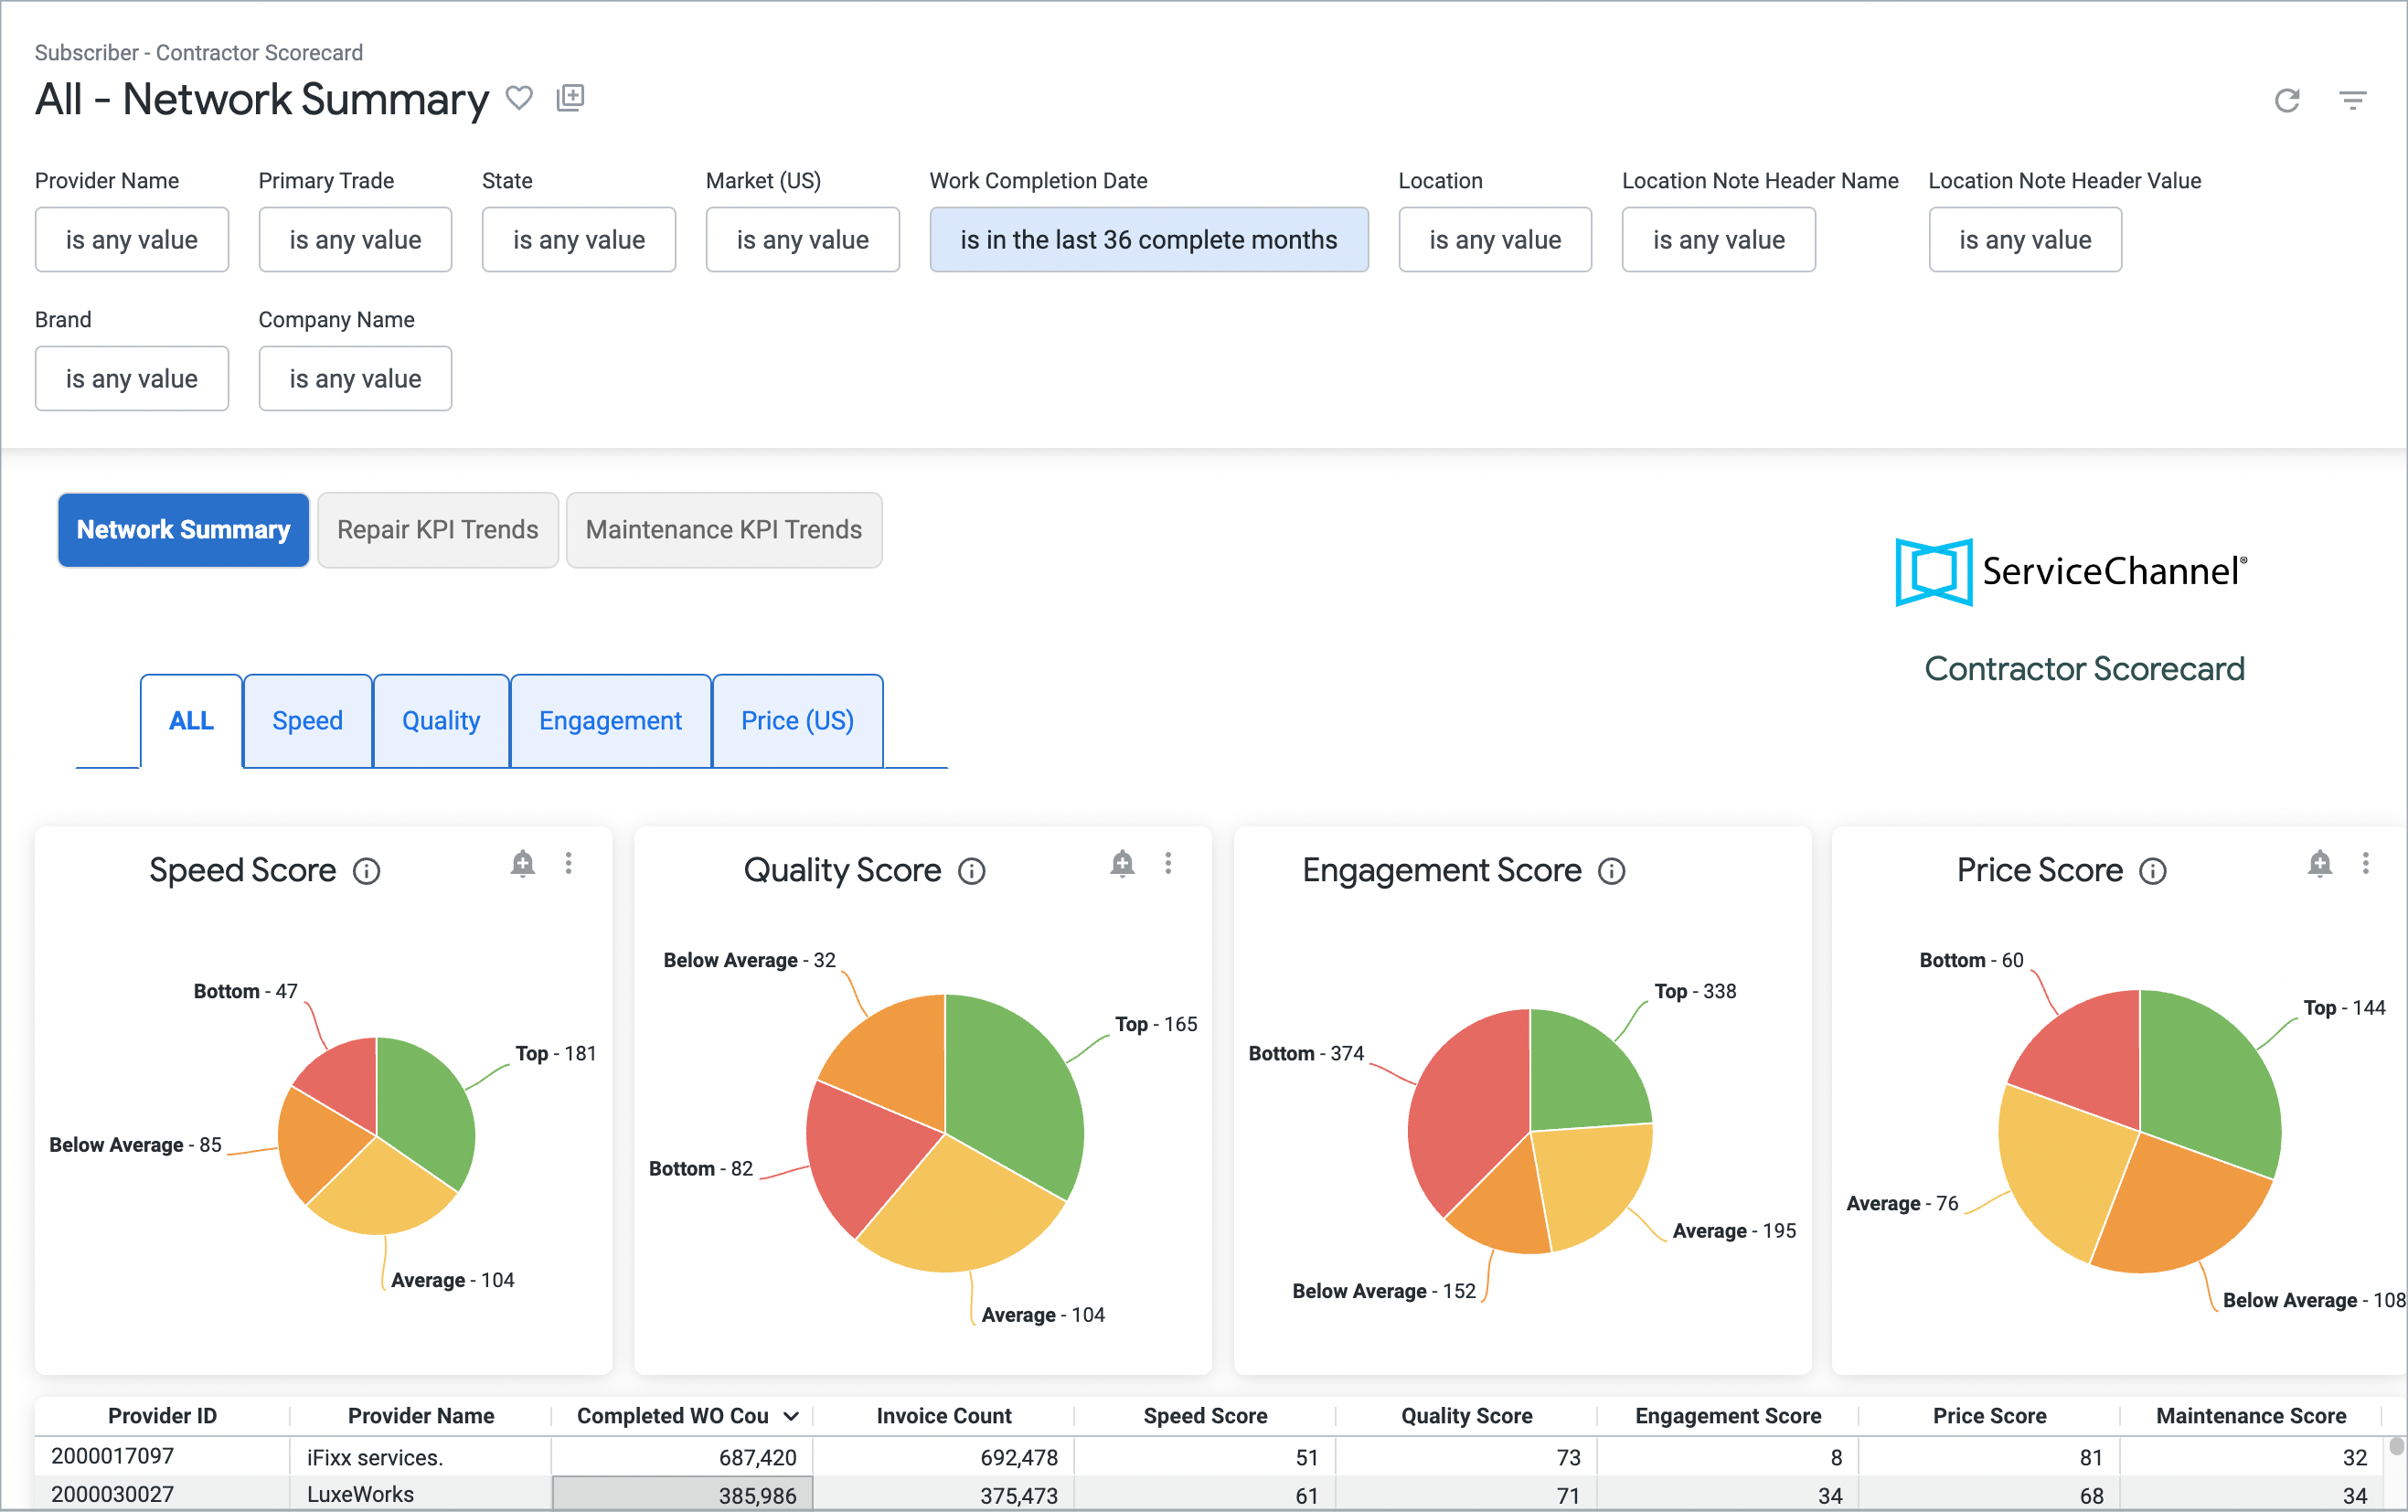
Dashboards
This dashboard provides a high-level view of KPIs across your entire network of providers that compares your provider scores against all ServiceChannel providers. You can use this dashboard to check in on the health/performance of your provider network as a whole or you can use this dashboard in quarterly business reviews with individual providers to see how individual performance is in comparison to not only your network, but the entire ServiceChannel platform.
This dashboard measures repair performance by Speed, Quality, Engagement, and Price. Each category has specific KPIs and drills down to scores and a 36 month trend of those scores. Use this dashboard to drill into key metrics on provider performance of repair work orders.
- Benchmarking
- This dashboard offers a comprehensive breakdown of provider performance by delving into each performance category's Key Performance Indicators (KPIs), allowing you to gain a genuine comparison of your providers performance to their true peers in your network and within the broader ServiceChannel platform.
This dashboard breaks down maintenance performance by the same KPIs as Contractor Scorecard 1.0. You can see the same scores as before, but now you can see consistency of performance over the last 36 months.
Score Subtabs
Network Summary and Repair KPI trends have subtabs for their KPI categories. Click through each one to drill in further on provider performance.
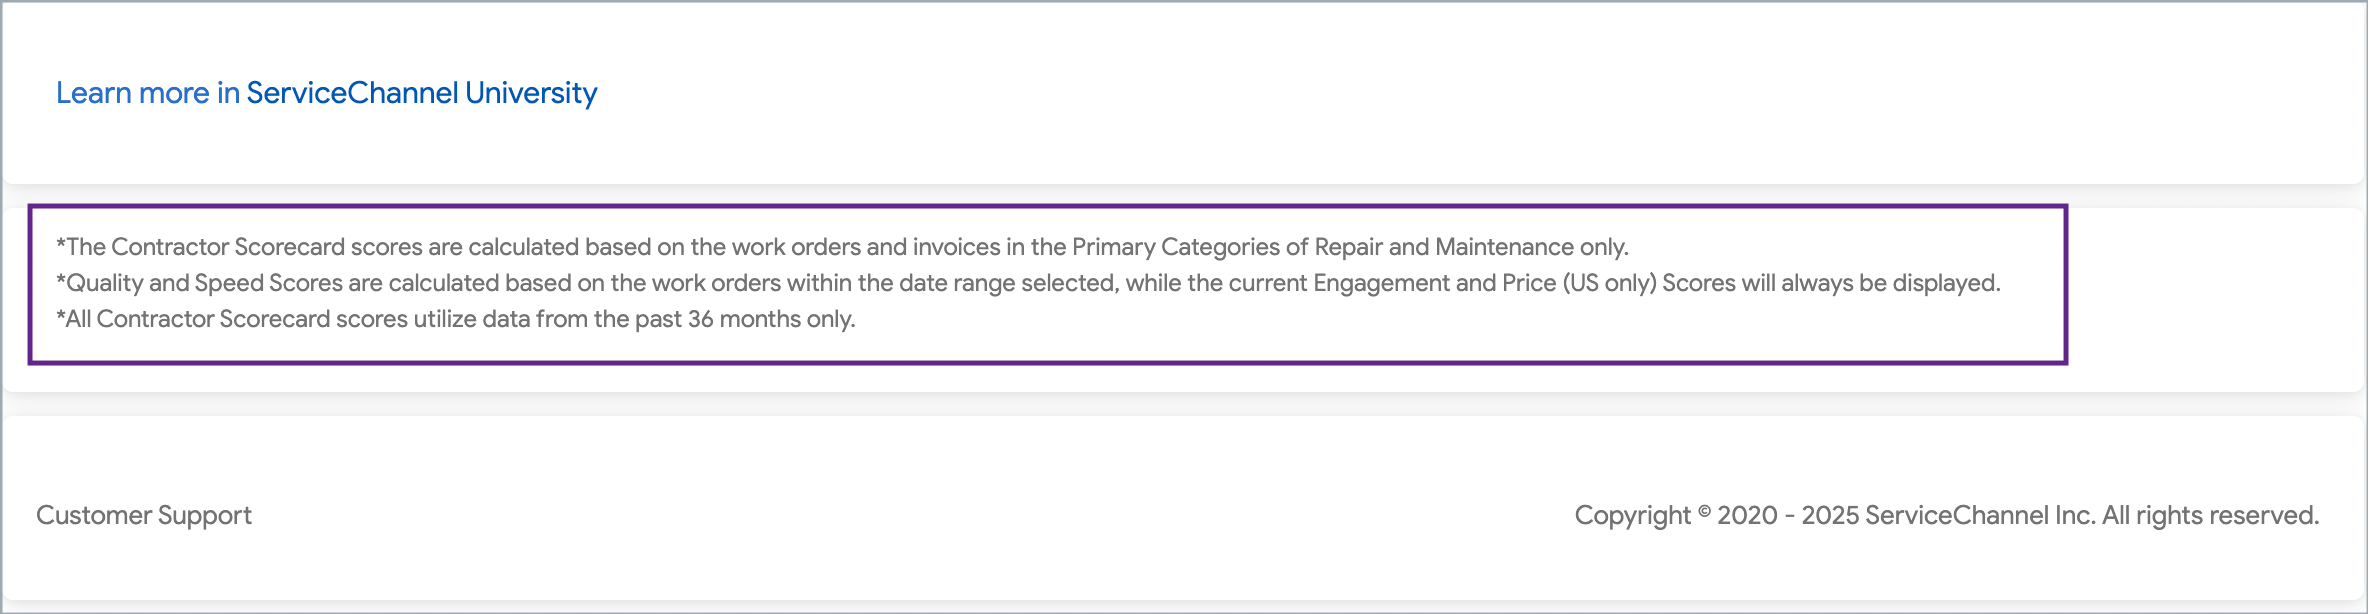
Notes
At the bottom of each page, there are notes to help you understand specifics of each scorecard and what is included. Review them as they are quite helpful!