Sections of the Main Analytics Area
The main section of Analytics the display area of all dashboards. This area is divided into 6 sections:
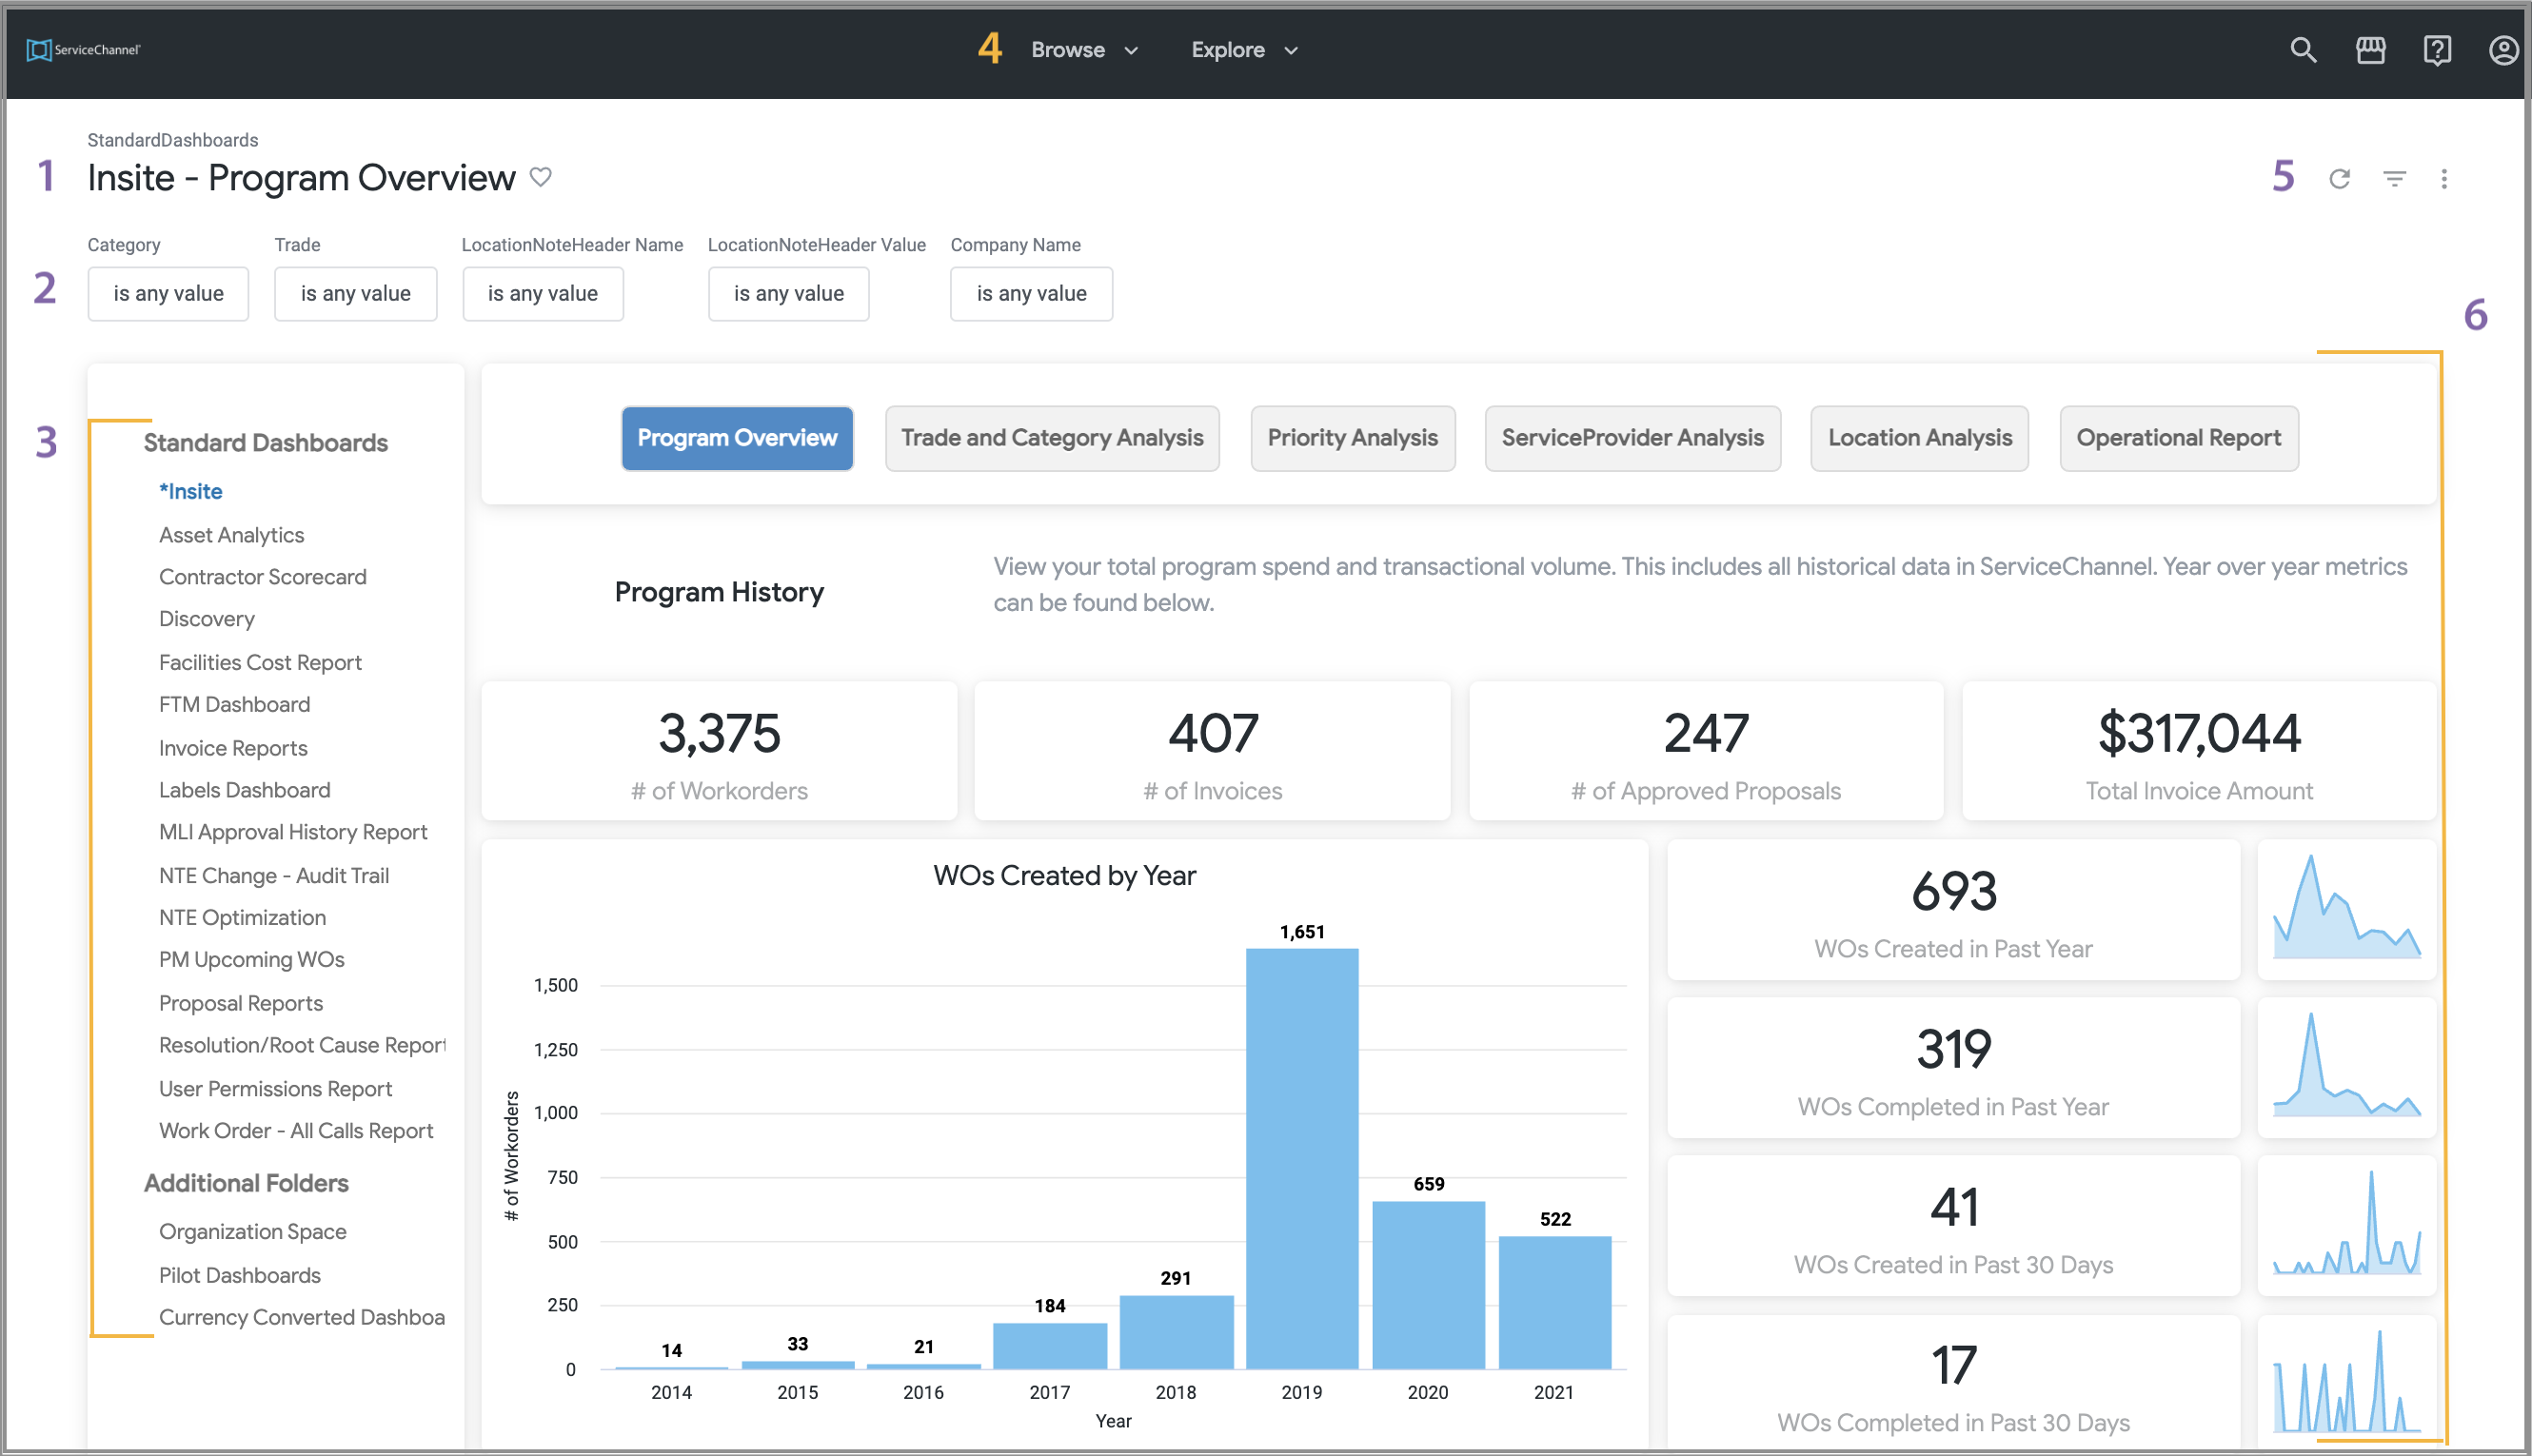
Selected Dashboard Name. The dashboard that is displayed in the Dashboard Display Area (section 6). Click the heart icon to save it as a favorite.
Filters. Click the arrow to view and select filter criteria for the selected report. See Filtering an Analytics Dashboard for more information.
Dashboards. ServiceChannel’s Standard Dashboards are available on the left pane. Click any Dashboard to see its respective data. See Standard Analytics Dashboards for more information.
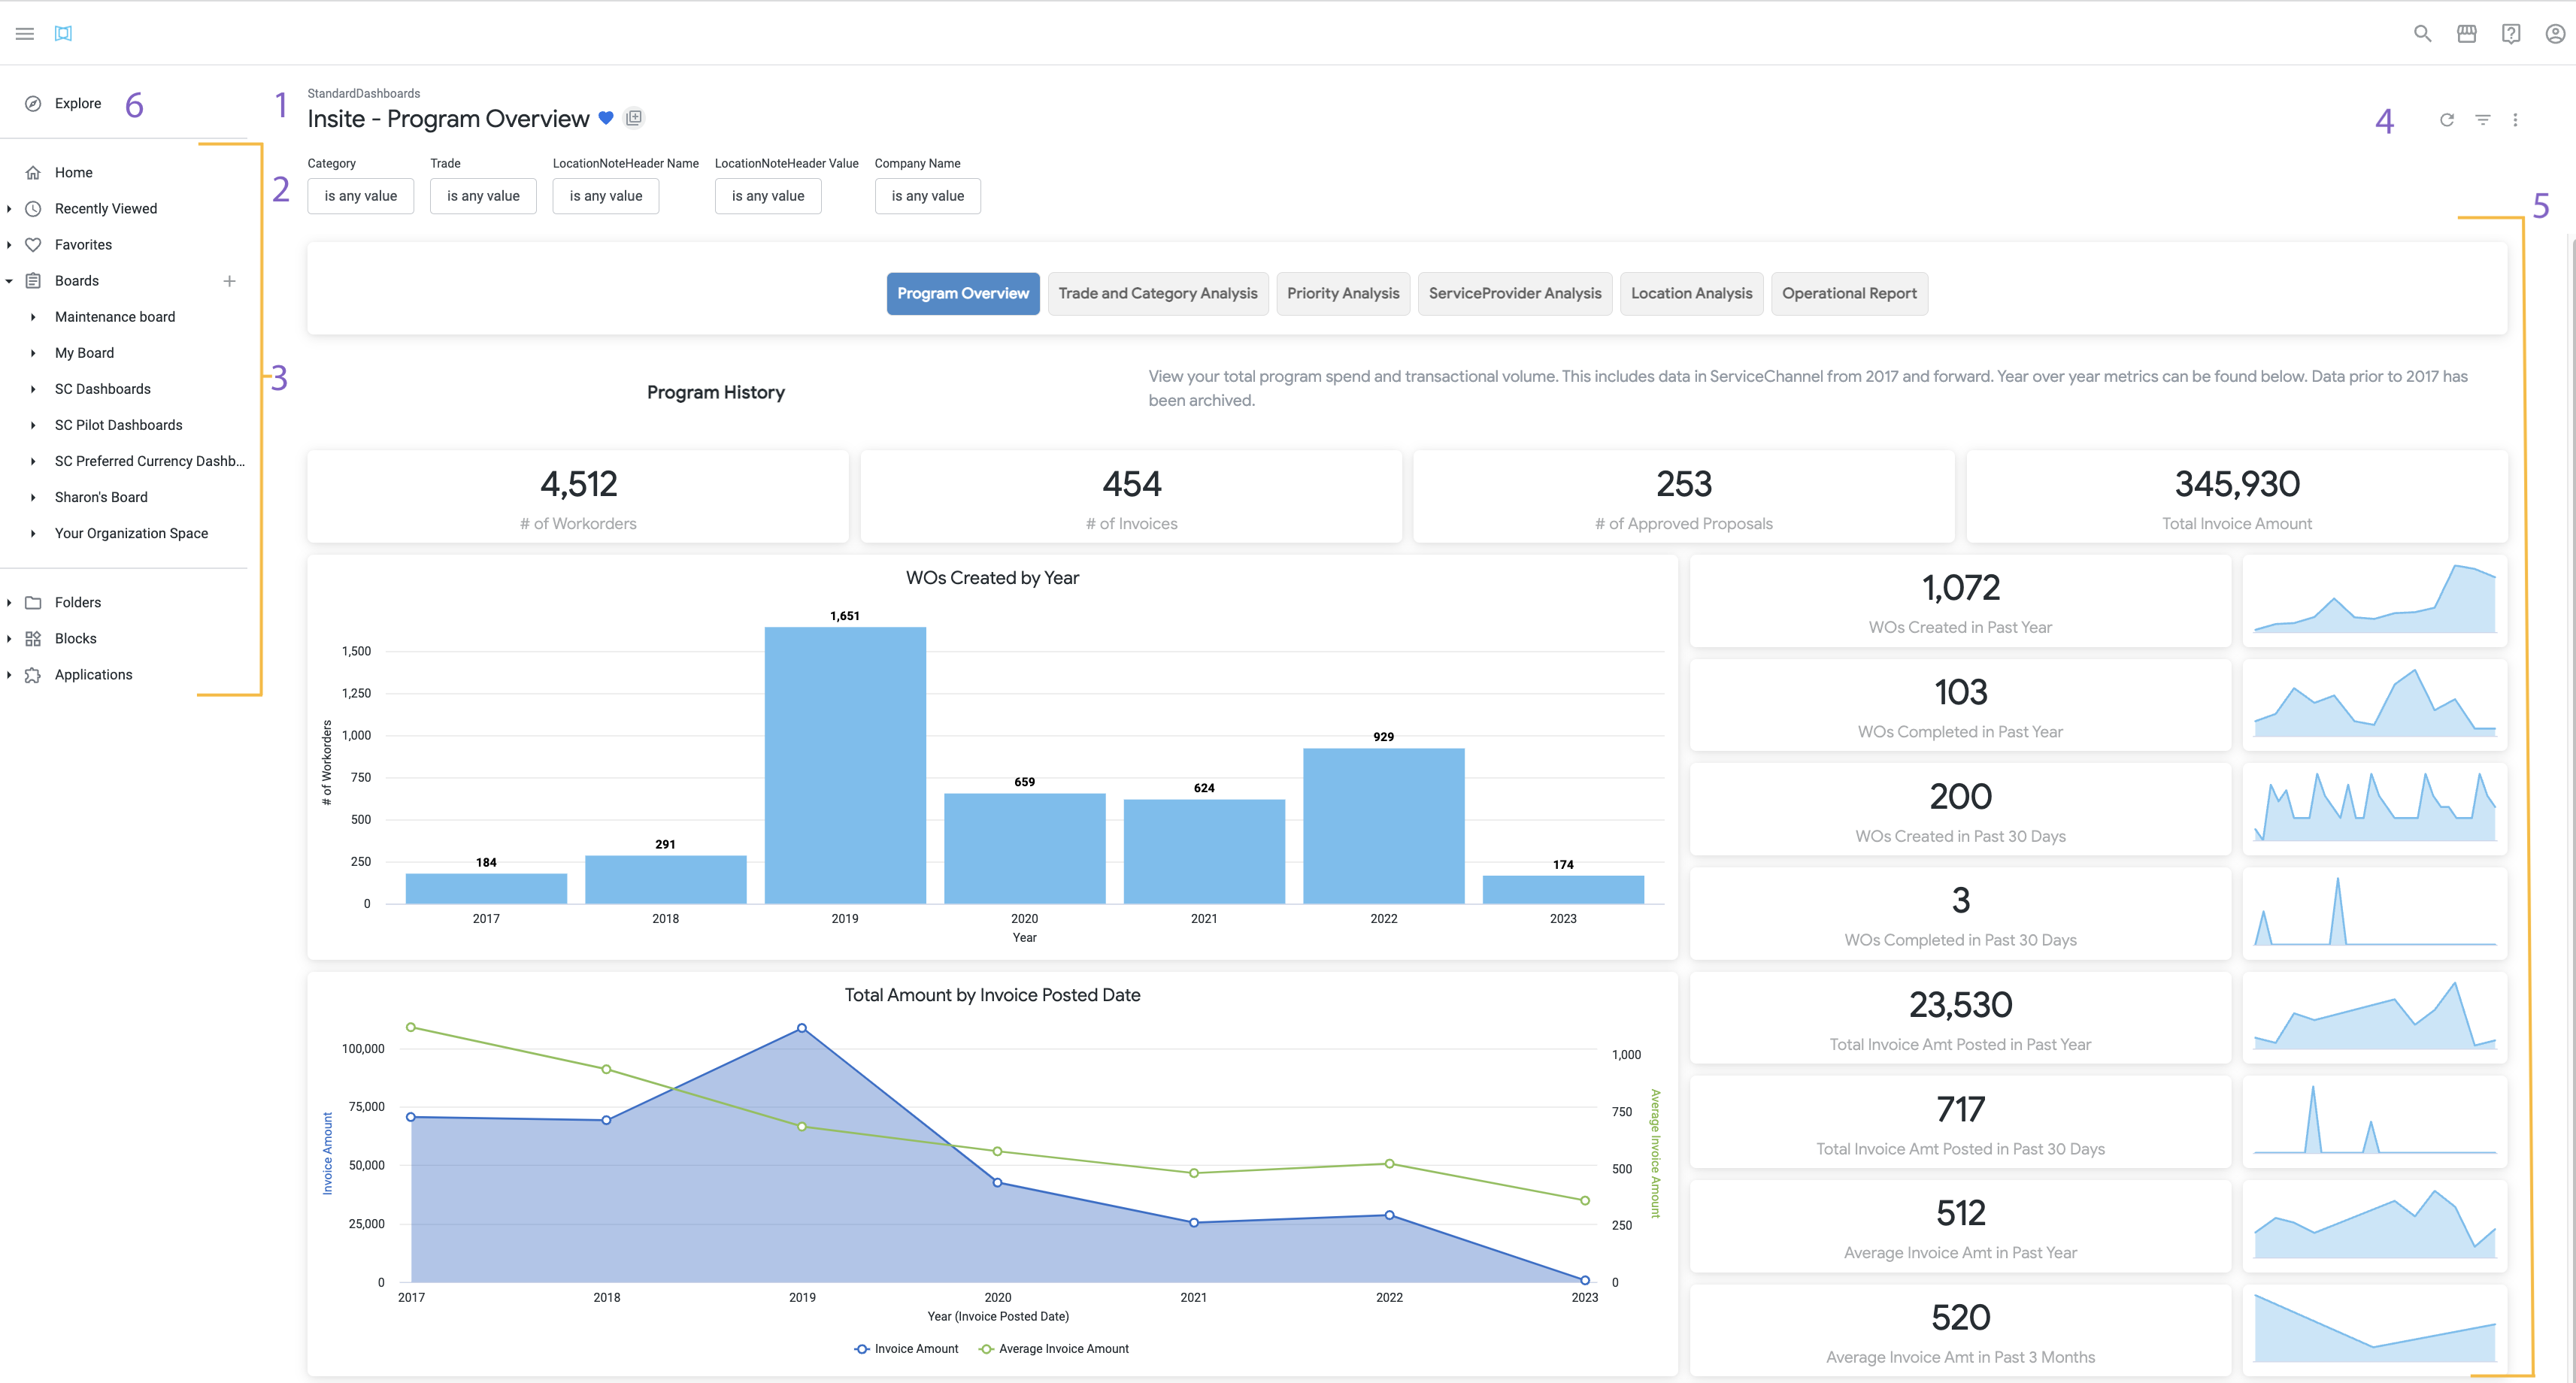
Browse Navigation Menu. Navigate to other areas of Analytics, including the dashboards you have saved as a favorite, as well as boards and custom folders (where accessible). See Navigating the Browse Menu, below, for more information.
Users with Premium Analytics will also see the Explore menu in this area, where expert users can build custom data visualizations. See Premium Analytics (Explore) for more information.
Refresh, Gear, and Icons.
Click Refresh after selecting filtering criteria. See Filtering an Analytics Dashboard for more information.
The Gear icon is where you can download, send, and schedule reports.
The Icons take you to Analytics help and your account information.
Dashboard Display Area. Selecting a Dashboard will load the data in the main area. Tabs along the top of this area depict all reports available on the selected Dashboard.
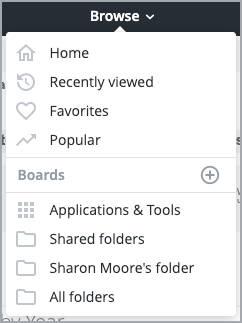
In the Browse menu you will see:
| Column | ||
|---|---|---|
| ||
|
| width | 60% |
|---|
- Home takes you back to the *Insite Dashboard.
- Recently viewed lists the last 10 dashboards you have viewed.
- Favorites are all dashboards you marked with a heart
- .
- Boards are your saved dashboards
- and Standard Analytics Dashboards.
- Saved dashboards are similar to a Favorite, however, a Board is a place where you can curate dashboards and looks, and then share it with others. You can also invite others to pin dashboards and looks to your board.
- and Standard Analytics Dashboards.
ServiceChannel’s Standard Dashboards are available on the left pane. Click any Dashboard to see its respective data. See Standard Analytics Dashboards for more information.
- Folder contains your personal folder and folders others have shared with you
- .
- (Name)'s folder is your personal bucket. Premium Analytics users can create custom dashboards and looks in this folder, and then share them with others when they are ready. Standard Analytics users will see this folder but cannot save custom dashboards and looks.
- .
- Shared folders
- are buckets that other users have shared with you that contain custom dashboards and looks.
Refresh, Gear, and Icons.
Click Refresh after selecting filtering criteria. See Filtering an Analytics Dashboard for more information.
The Gear icon is where you can download, send, and schedule reports.
The Icons take you to Analytics help and your account information.
Dashboard Display Area. Selecting a Dashboard will load the data in the main area. Tabs along the top of this area depict all reports available on the selected Dashboard.
- Explore. Users with Premium Analytics will also see the Explore menu where expert users can build custom data visualizations. See Premium Analytics (Explore) for more information.
| Live Search | ||||||||
|---|---|---|---|---|---|---|---|---|
|
| Panel | ||||||||
|---|---|---|---|---|---|---|---|---|
| ||||||||
|
| Panel | ||||||||||||
|---|---|---|---|---|---|---|---|---|---|---|---|---|
| ||||||||||||
|