The *InSite Dashboard provides a detailed view of many aspects of your facilities operations, contractor performance, repair and maintenance spend, and assets. The InSite Dashboard is comprised of the following reports: 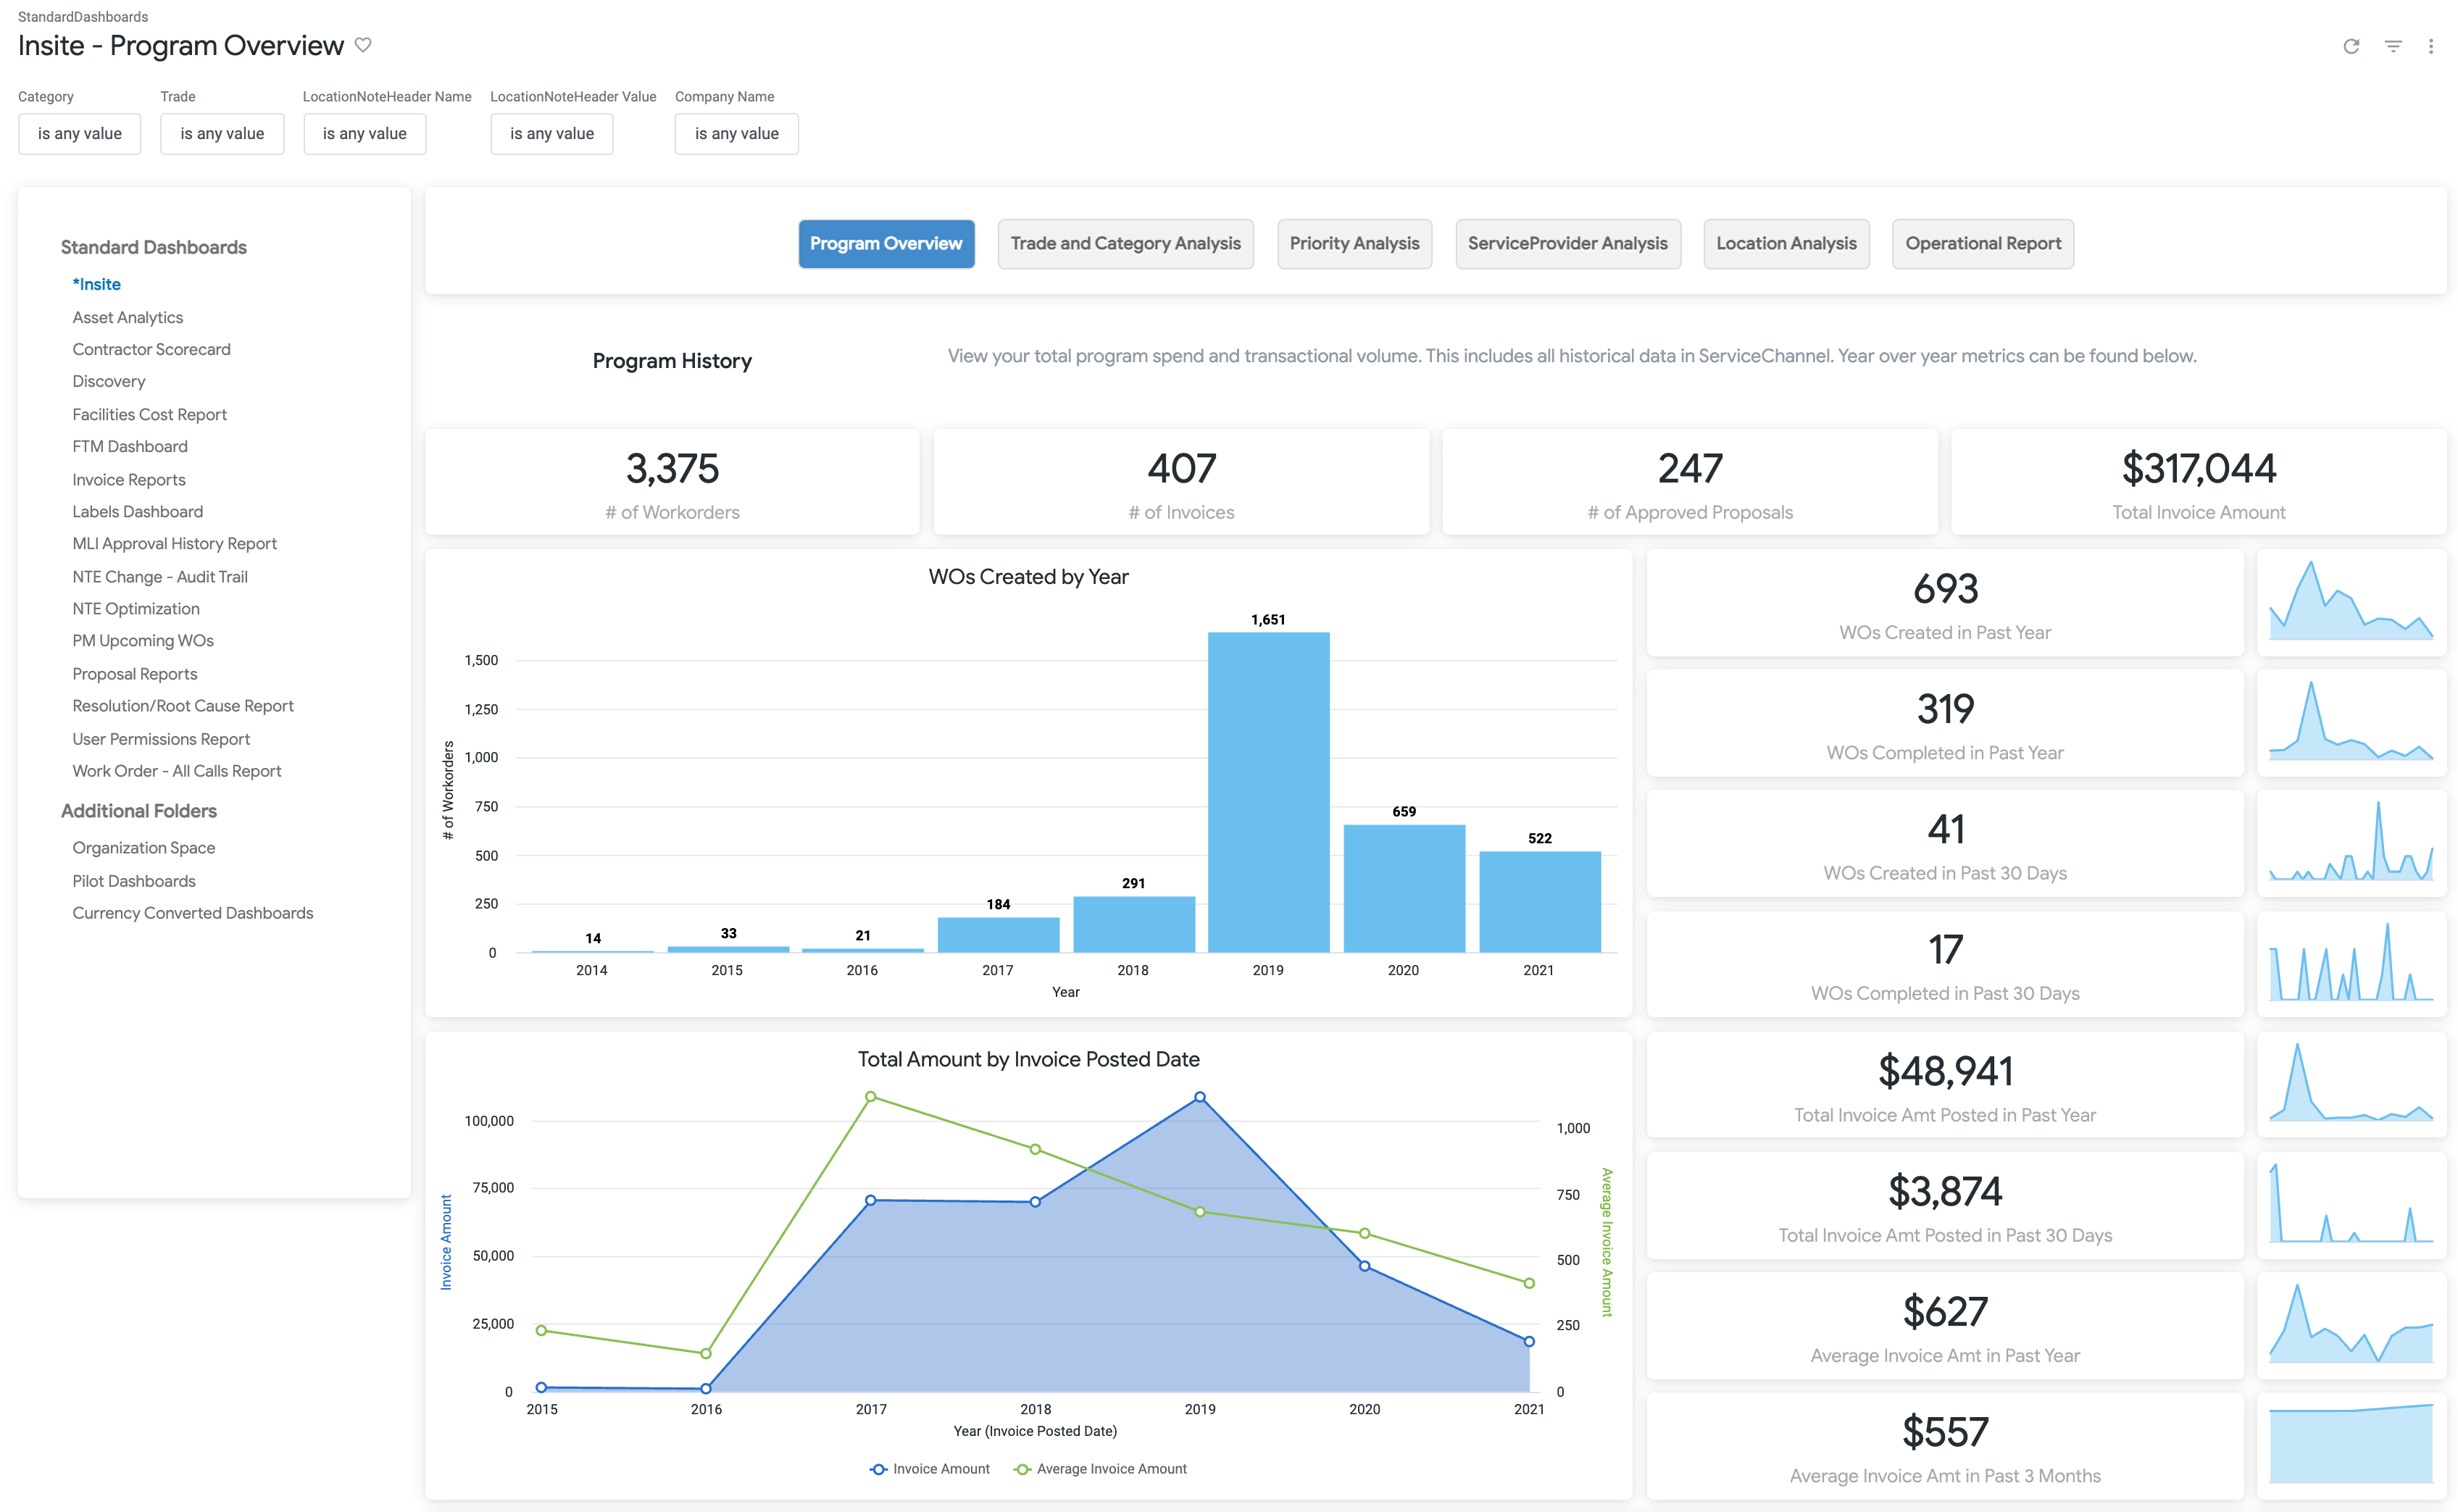 Image Removed Image Removed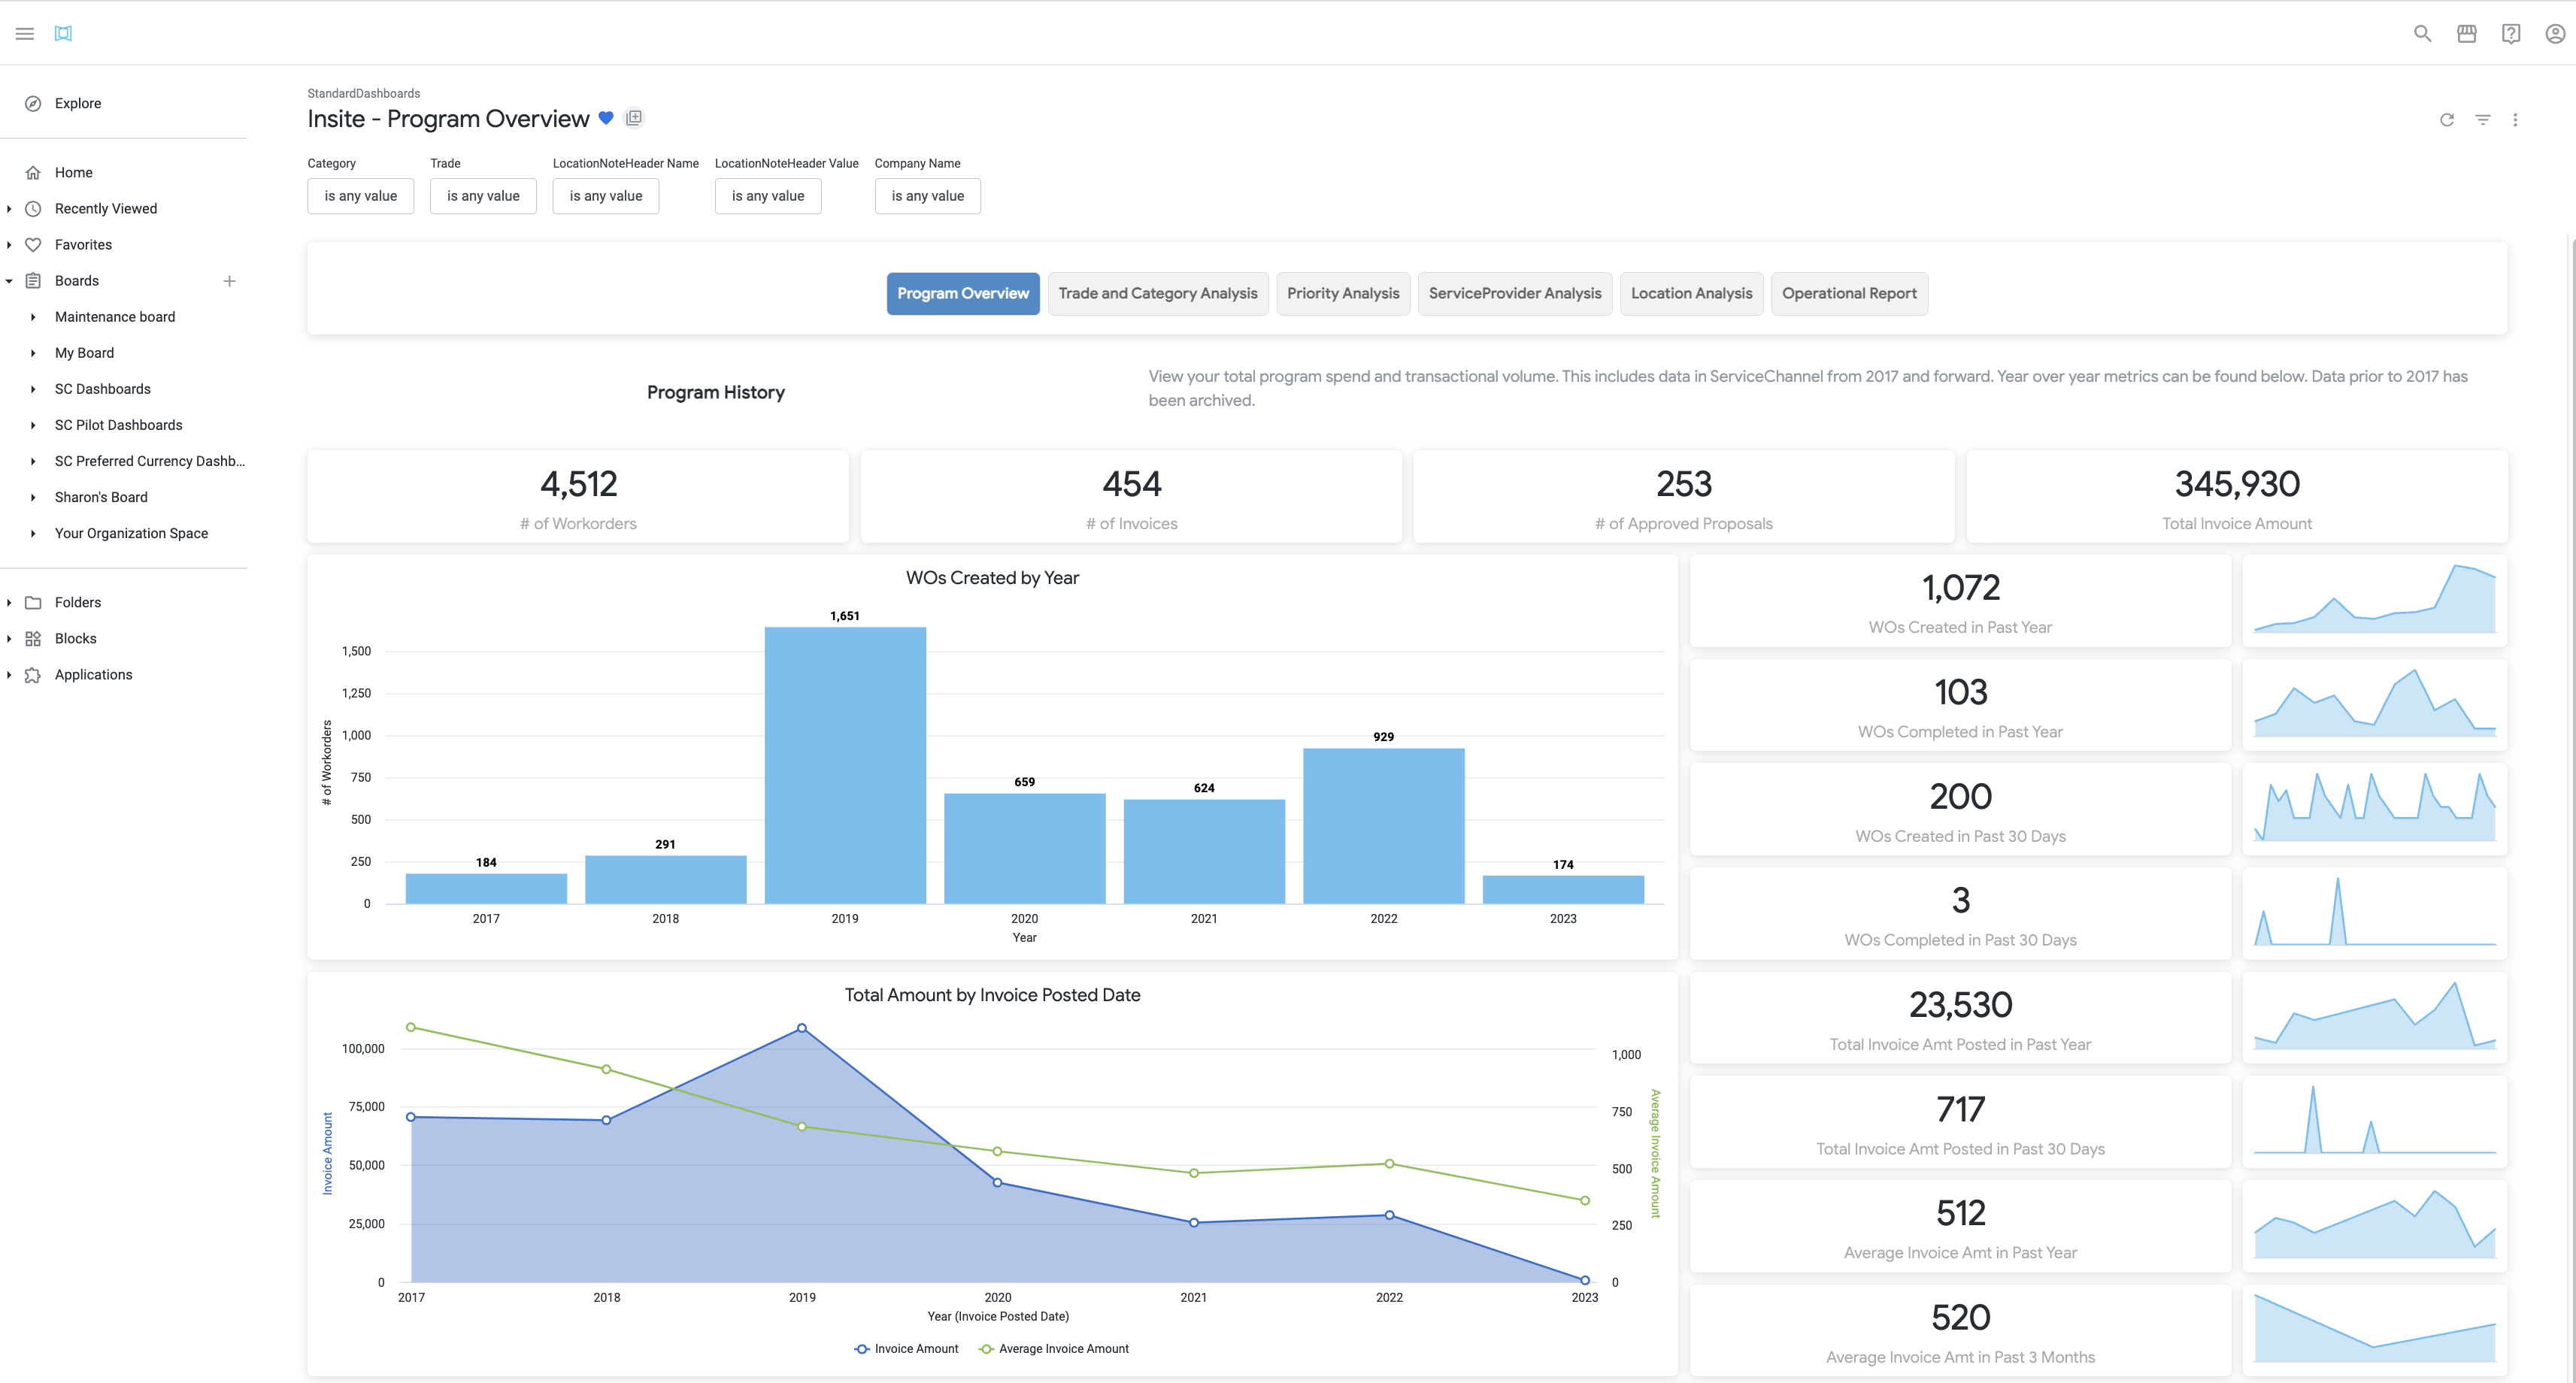 Image Added Image Added
- Program Overview: Historical overview of your company’s total Work Orders created, as well as the total and average invoice dollars spent. This tab is open by default when you access Analytics.
- Trade and Category Analysis: A visual snapshot of the top 10 trades and categories that account for a majority of your dollars spent.
- Priority Analysis: Categorizes your company’s work orders by priority, as well as your spend by priority.
- Service Provider Analysis: Categorizes the invoice amount for your top providers, the average invoice amount paid to each provider, the average number of days to resolve work orders, and the average number of hours providers spent on site.
- Location Analysis: Analyzes location-specific data such as top 10 highest spending regions, top 15 highest spending locations, work order counts by state or province, and average invoice amount by state or province.
- Operational Report: Shows the status of Work Orders, Proposals and Invoices.
| 