The Benchmarking - Summary Dashboard is an aggregate of spend and efficiency KPIs across all trades and compares your facility management program against your peers. This independent perspective enables you to identify areas where you might be spending more than your peers or spending less and could actually justify a larger budget if it enhances facility performance. If there are less than 5 peers in your filtered data set, you will see the message too few peers.
Sections in this dashboard are:
- 2423456691Data Visualization
Number presentation of metric
Total number of peers benchmarked against
Data is updated on the 2nd Sunday of each month. You can download the data for each visualization and email reports to recipients.
| Anchor | ||||
|---|---|---|---|---|
|
Data Visualization
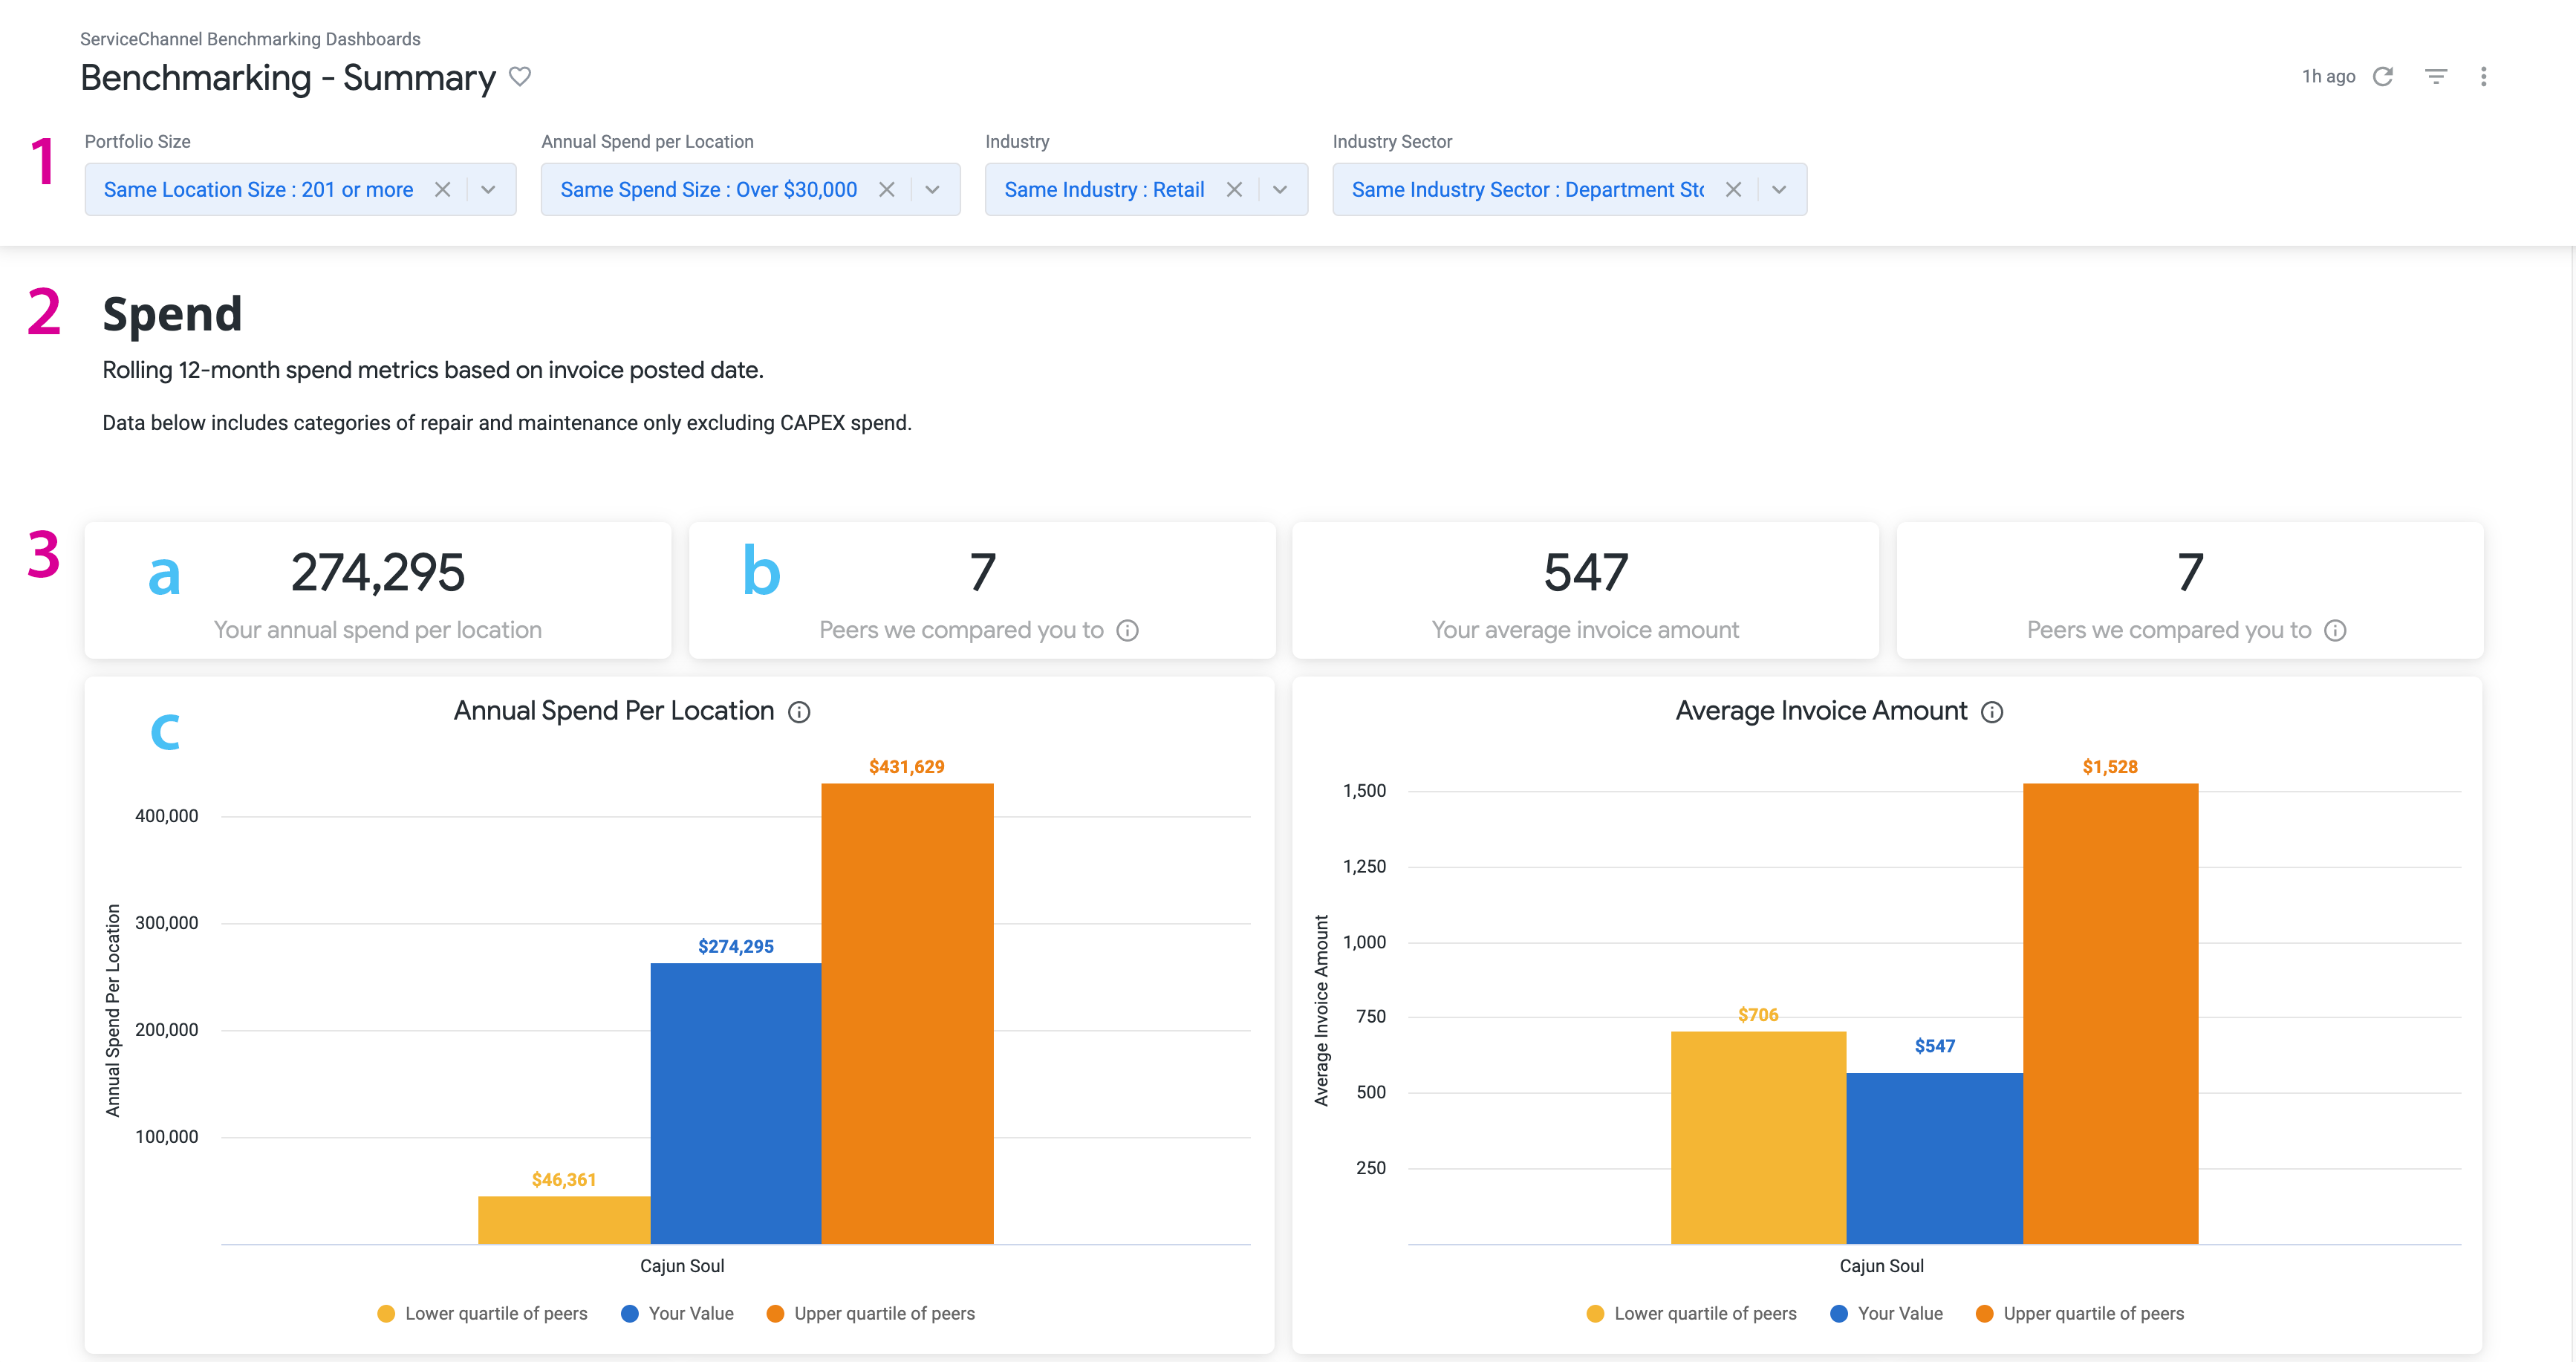
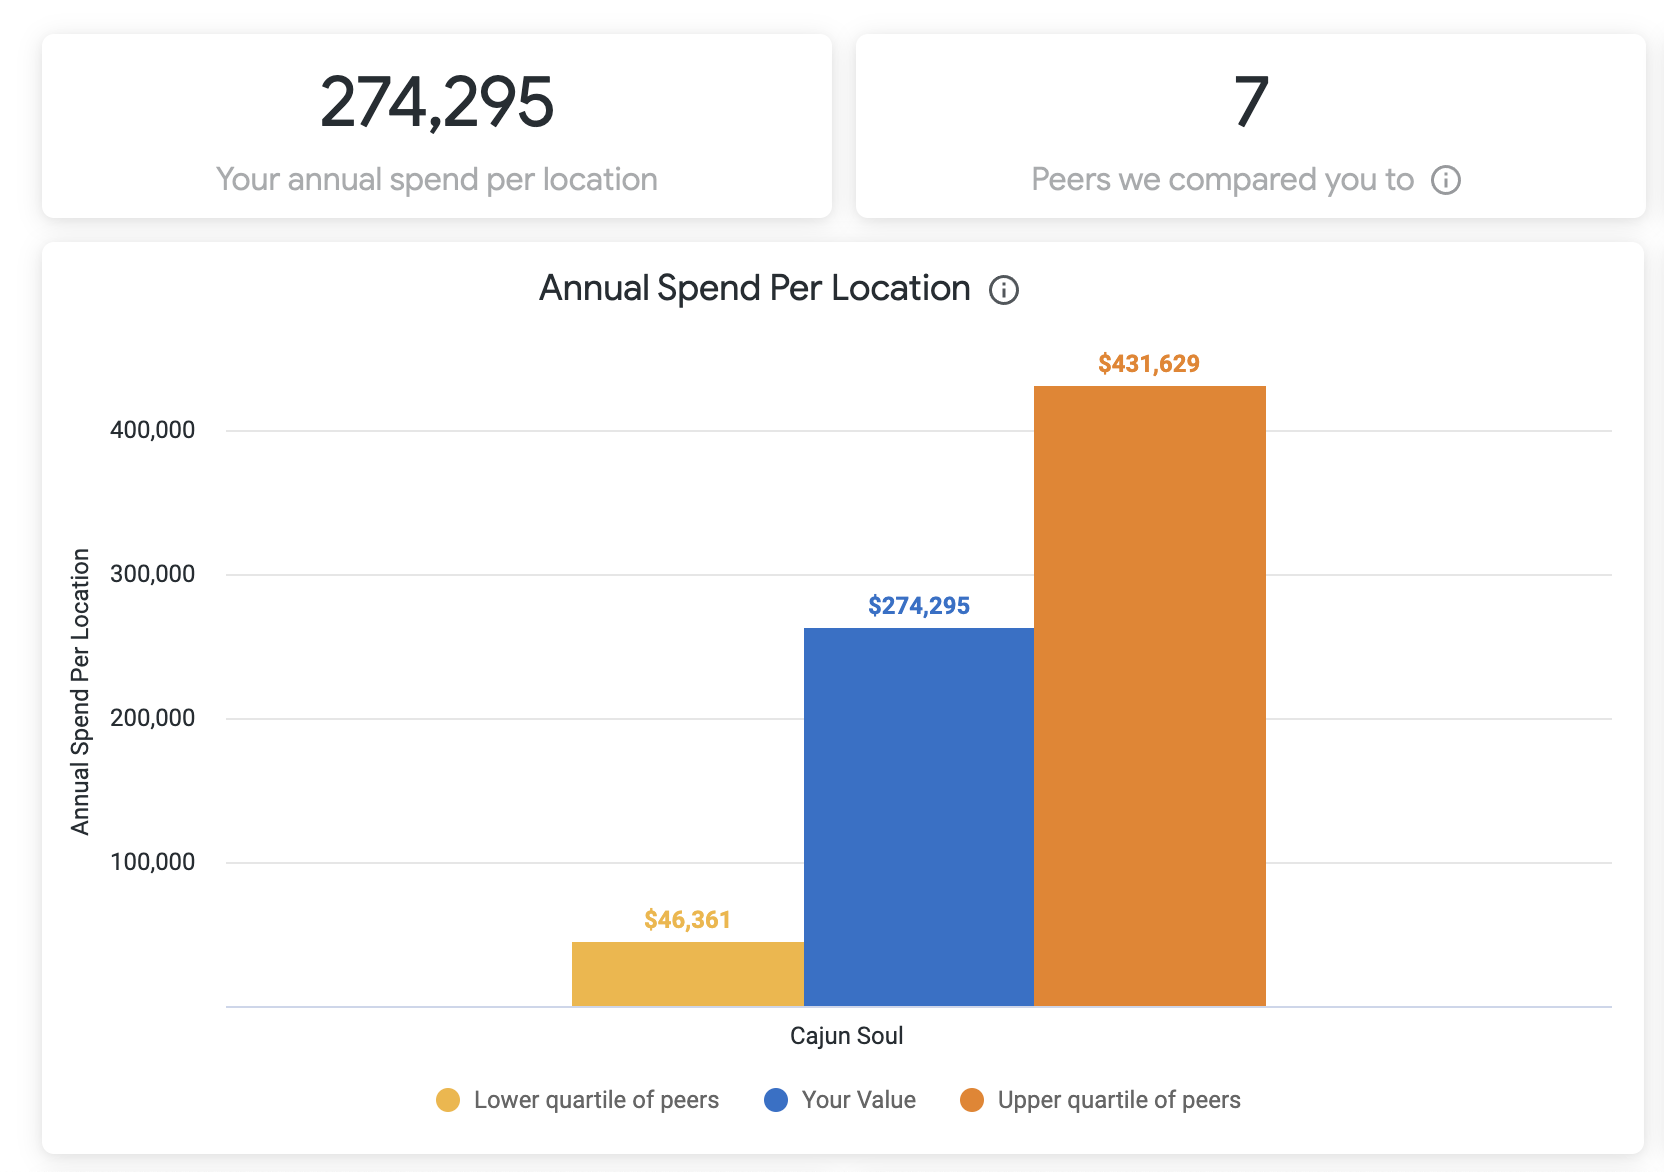
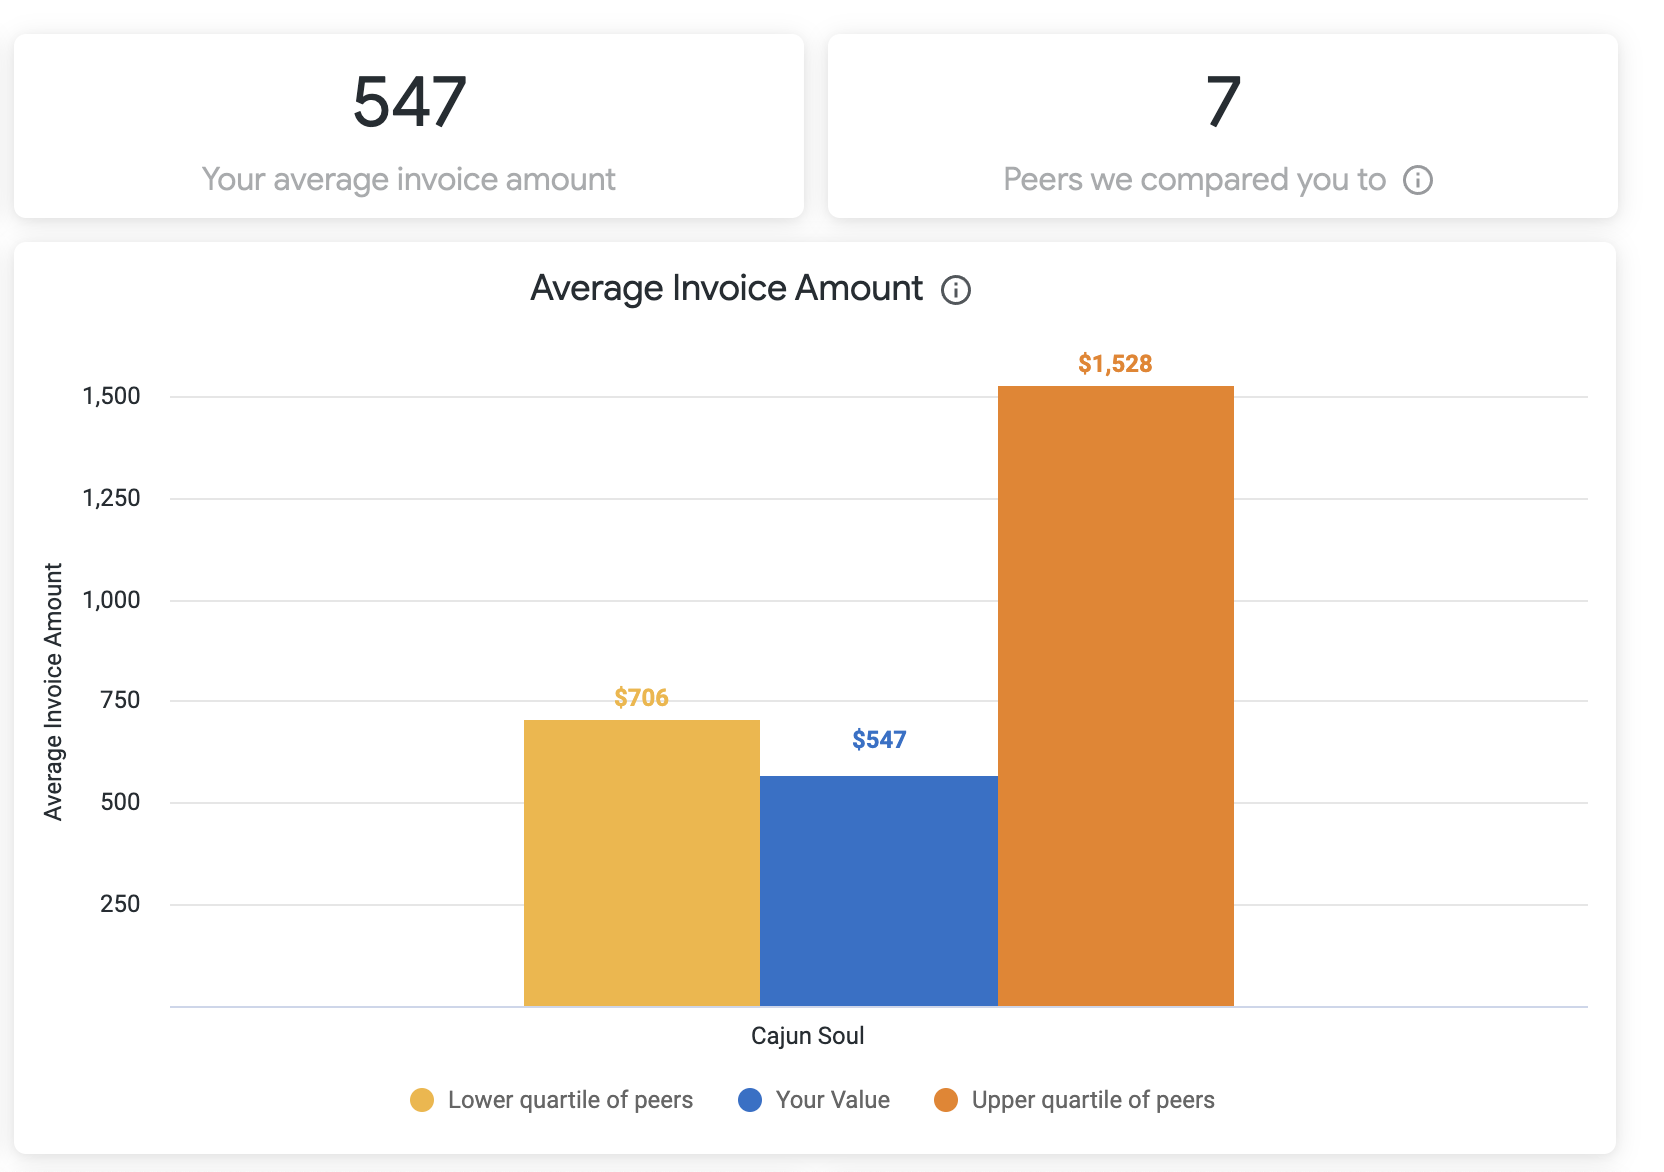
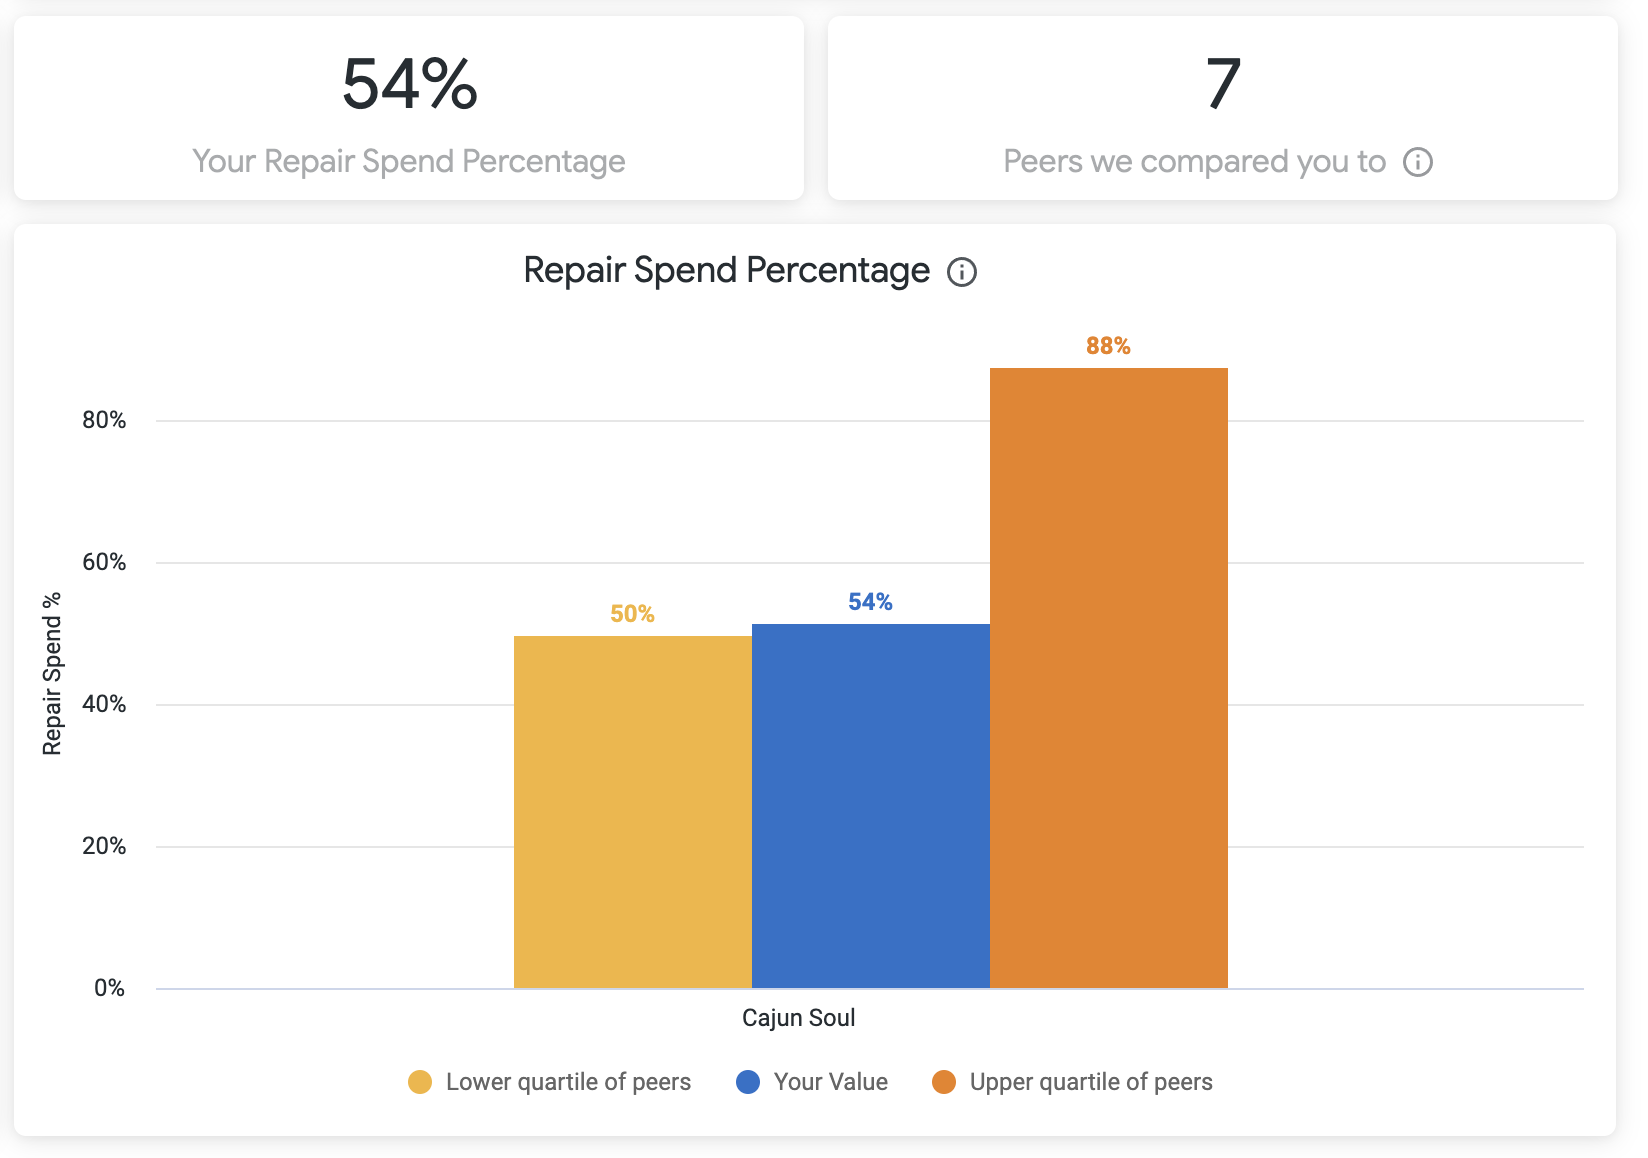
Spend
Metrics used in this section are based on the invoice date from the last rolling 12 months.
| Note |
|---|
Should you have less than 12 months of data, this visualization will not be an "apples-to-apples" comparison when viewed against peers. |
| Section | ||||||||||
|---|---|---|---|---|---|---|---|---|---|---|
|
| Section | ||||||||||
|---|---|---|---|---|---|---|---|---|---|---|
|
| Section | ||||||||||
|---|---|---|---|---|---|---|---|---|---|---|
|
| Section | ||||||||||
|---|---|---|---|---|---|---|---|---|---|---|
|
| Note | ||
|---|---|---|
| ||
Maintenance and Repair spend do not include CAPEX amounts. |
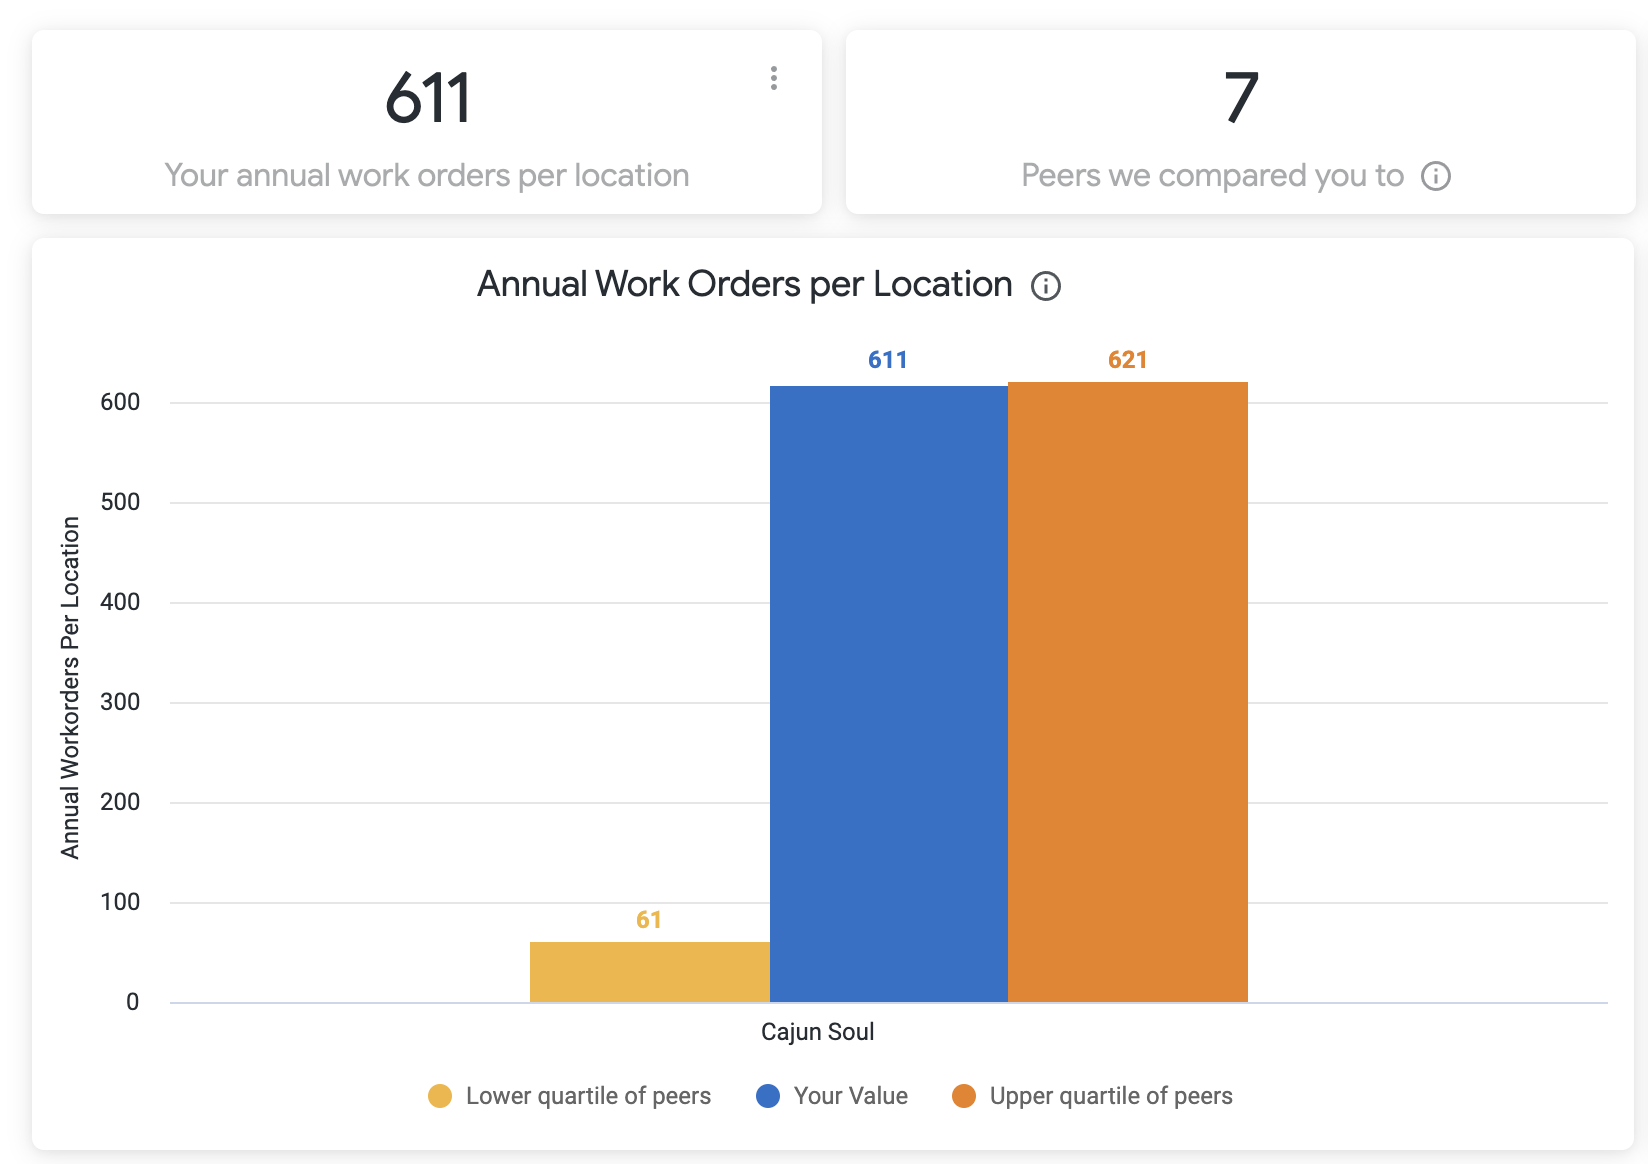
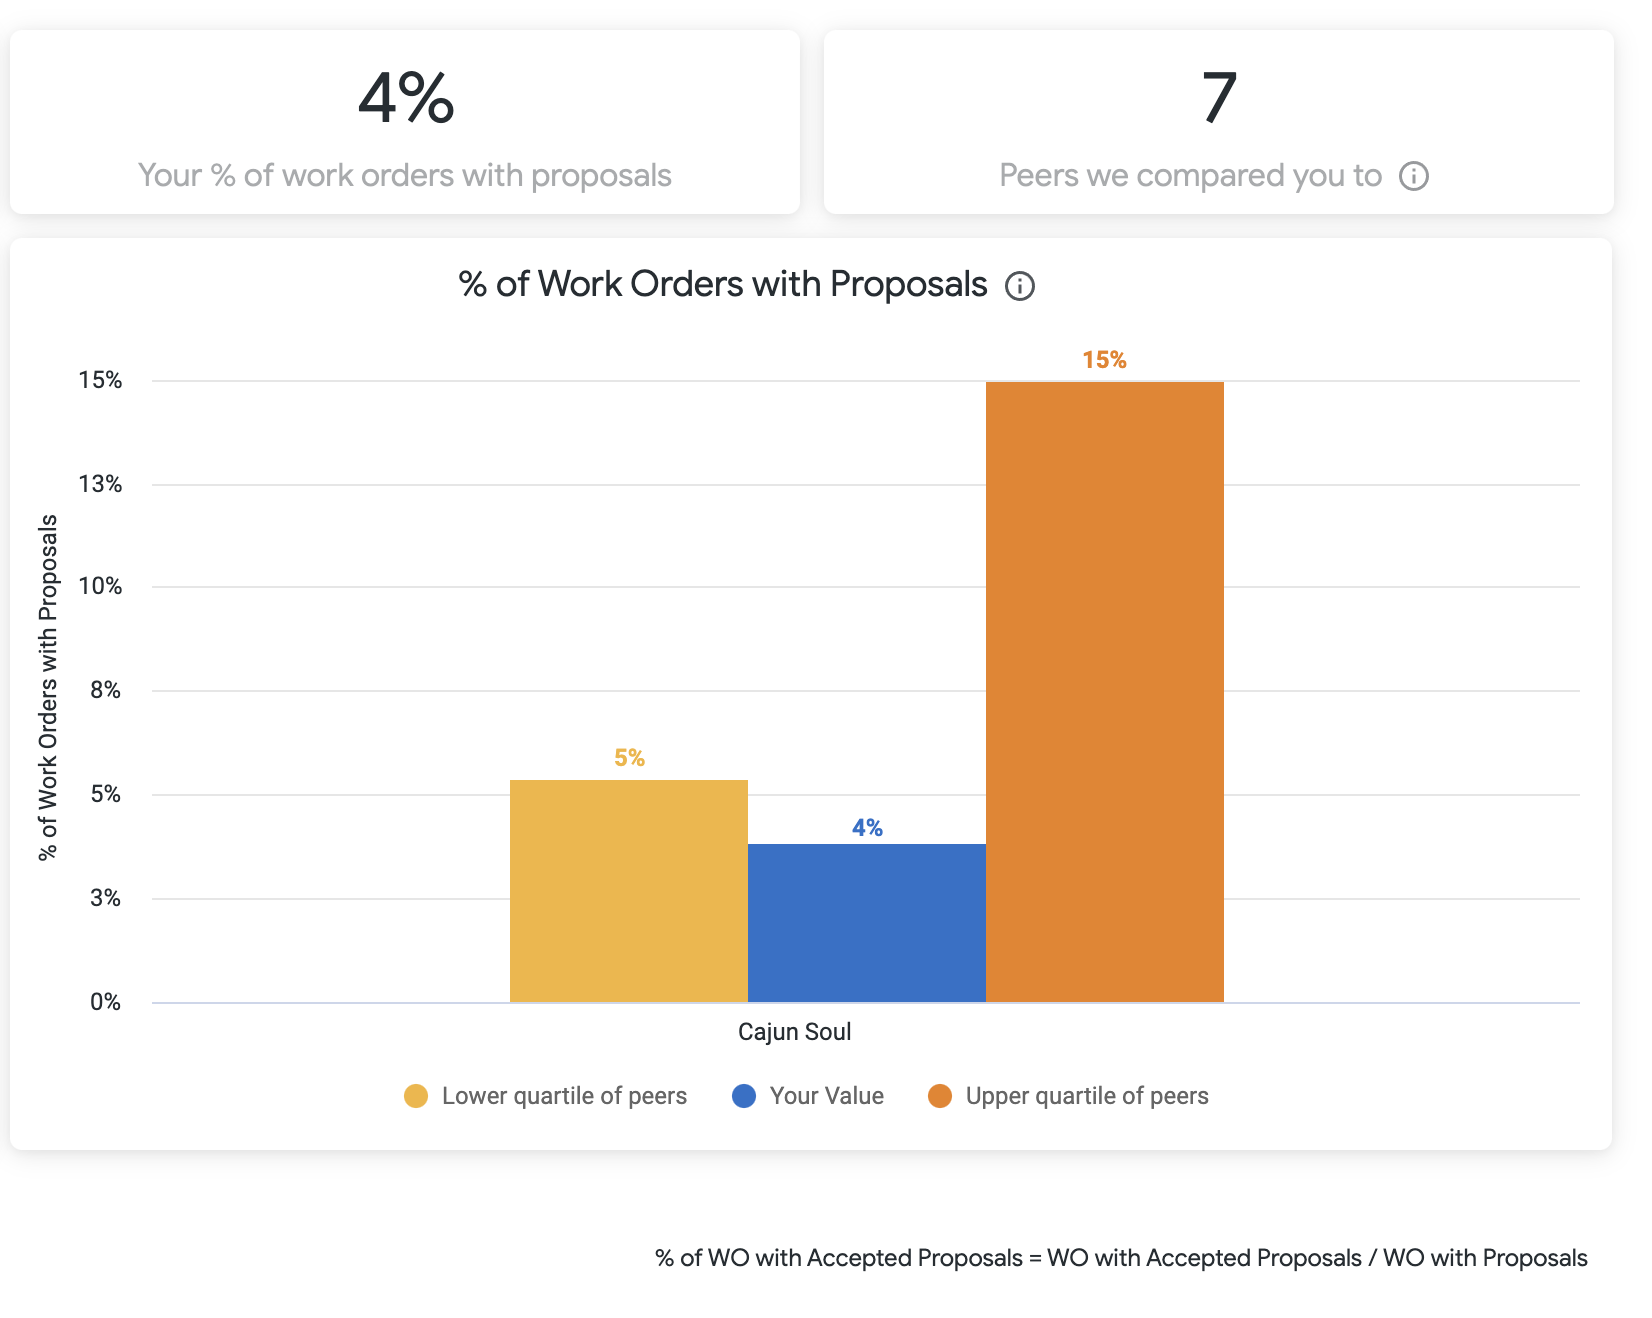
Workorder Volume
Metrics used in this section are based off the call date from the last rolling 12 months.
| Section | ||||||||||
|---|---|---|---|---|---|---|---|---|---|---|
|
| Section | ||||||||||
|---|---|---|---|---|---|---|---|---|---|---|
|
| Note | ||
|---|---|---|
| ||
The accepted proposal percentage is calculated by dividing the number of repair work orders with proposals by the total number of repair work orders. |
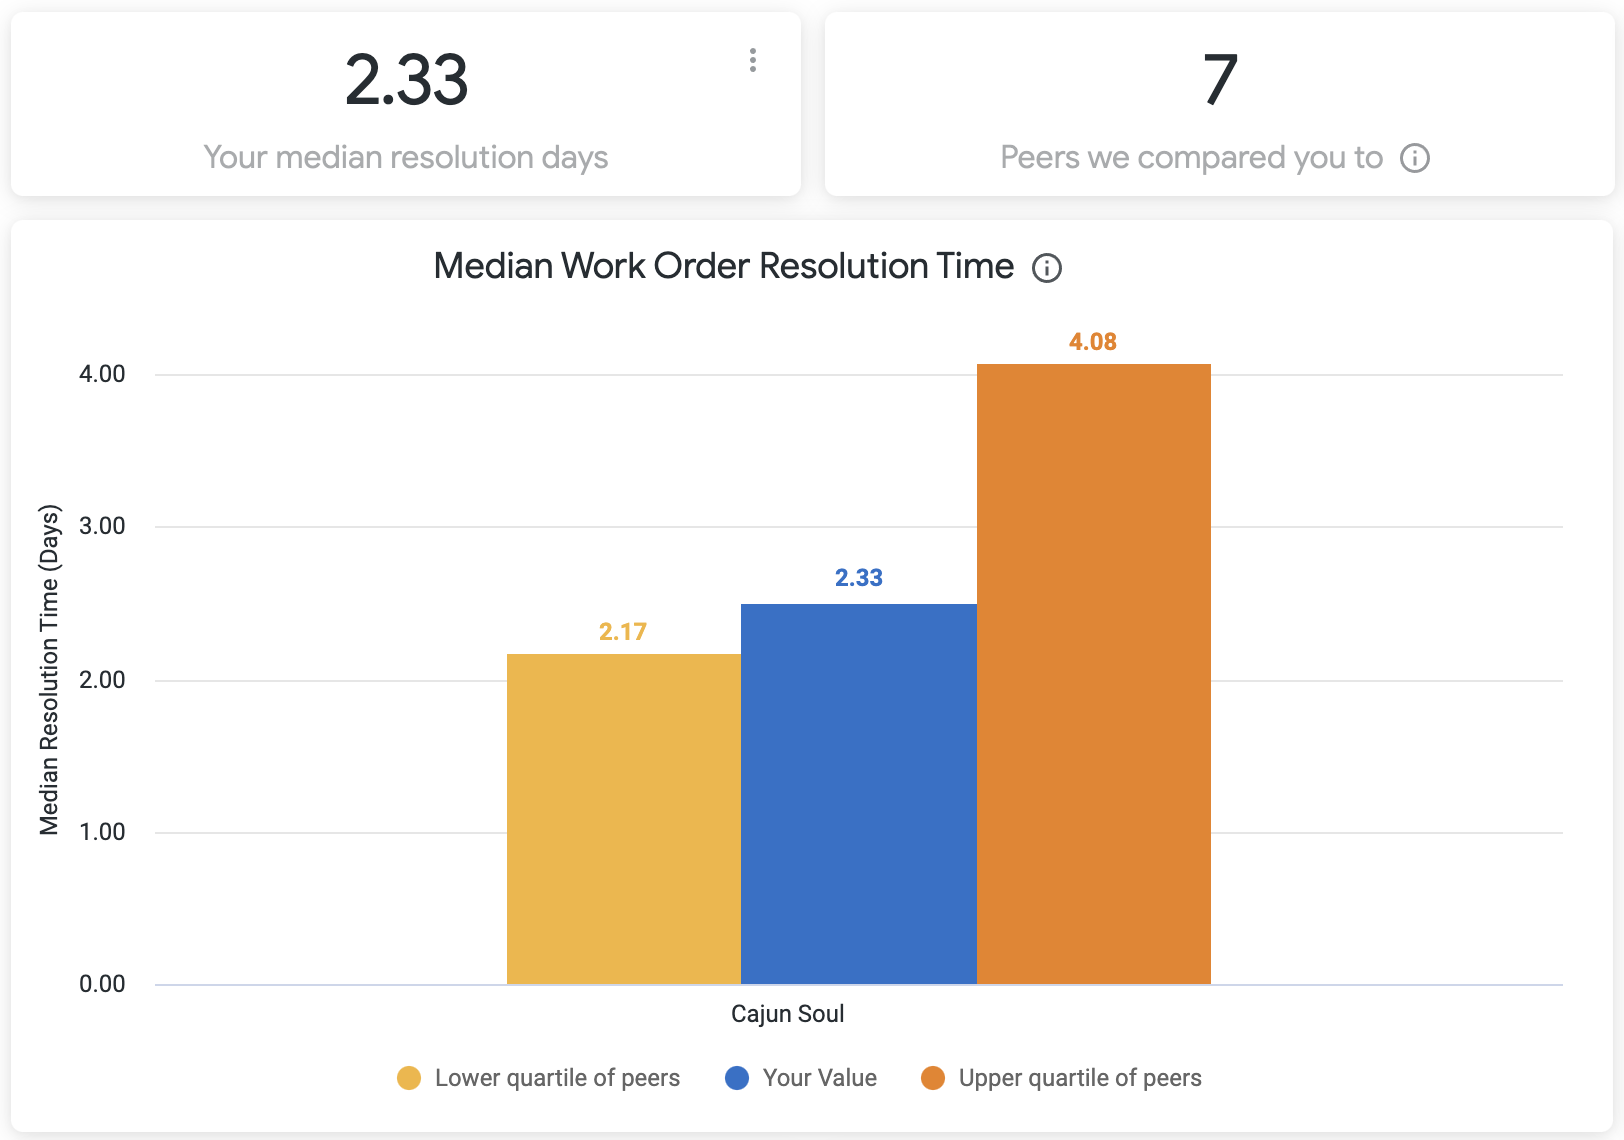
Efficiency
Time metrics used in this section are based off the call date from the last rolling 12 months.
| Section | ||||||||||
|---|---|---|---|---|---|---|---|---|---|---|
|
| Note | ||
|---|---|---|
| ||
Work order resolution time is calculated as the median minutes difference between the call date and completion date. |
| Section | ||||||||||
|---|---|---|---|---|---|---|---|---|---|---|
|
| Note | ||
|---|---|---|
| ||
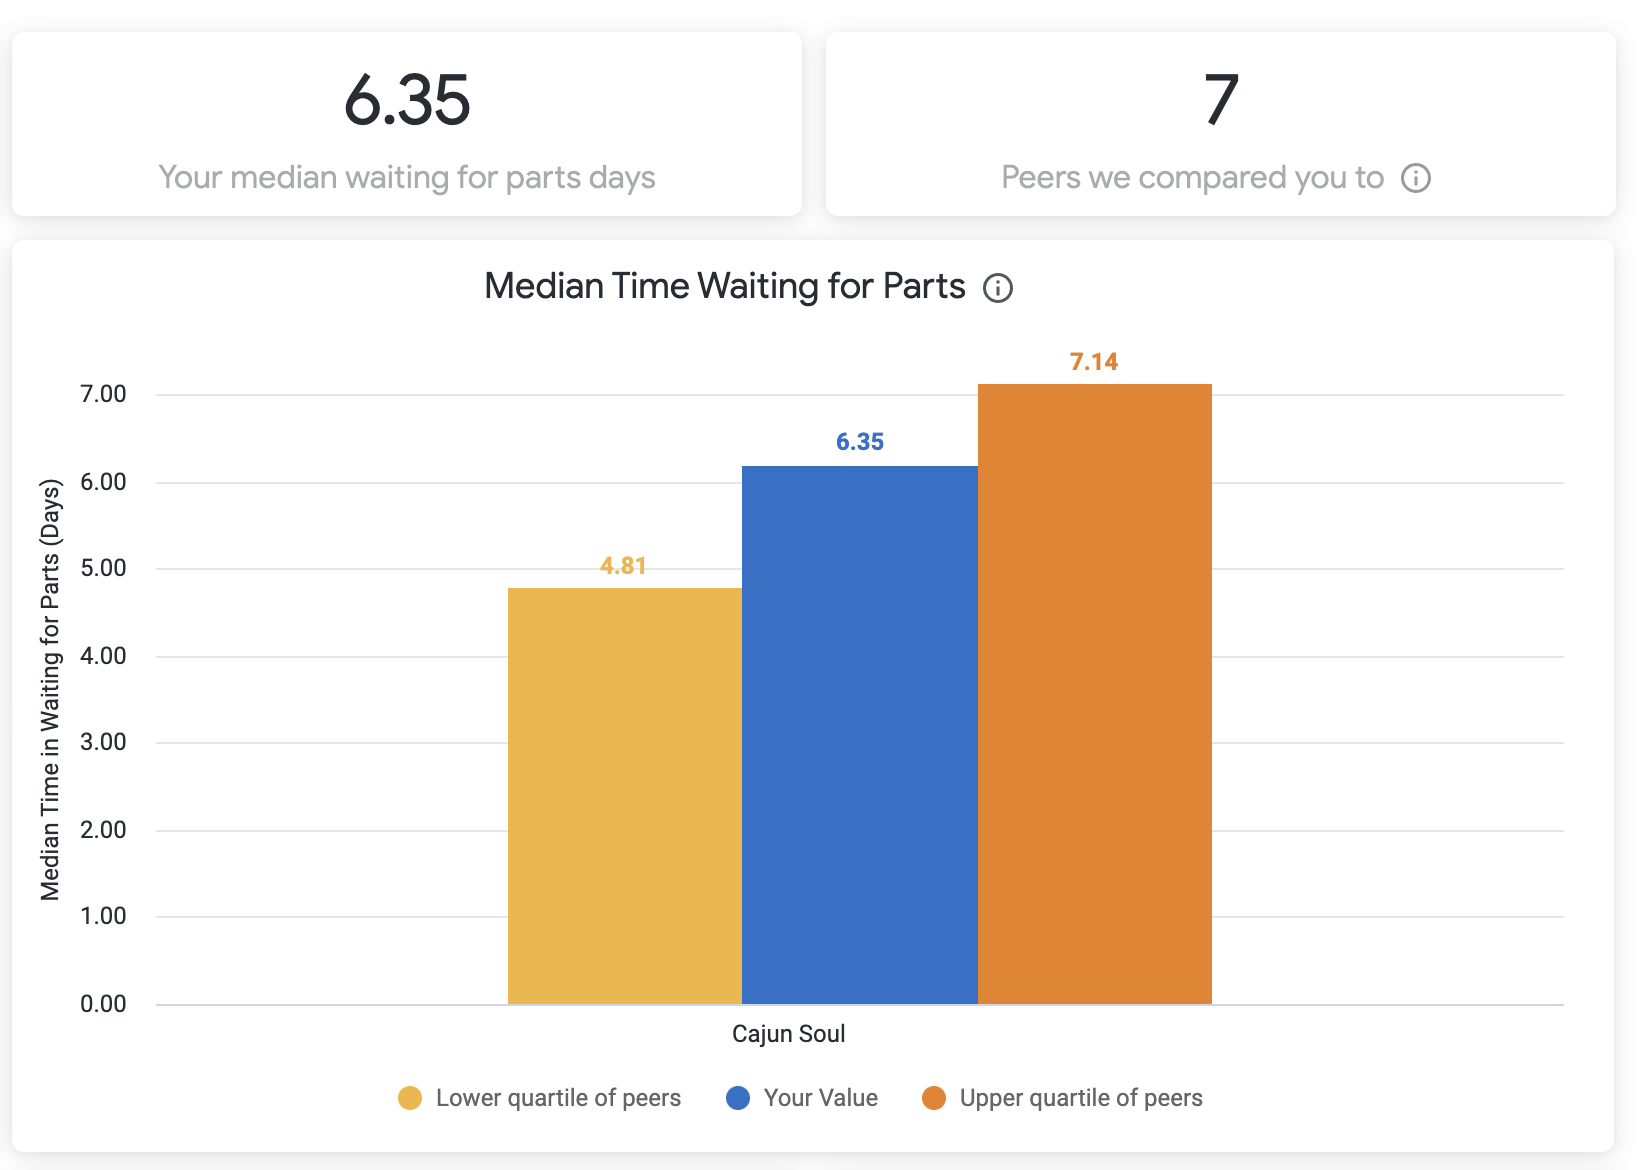
Median waiting for parts time is calculated by the SUM of minutes difference from any PARTS related status to the next status. |
| Section | ||||||||||
|---|---|---|---|---|---|---|---|---|---|---|
|
| Note | ||
|---|---|---|
| ||
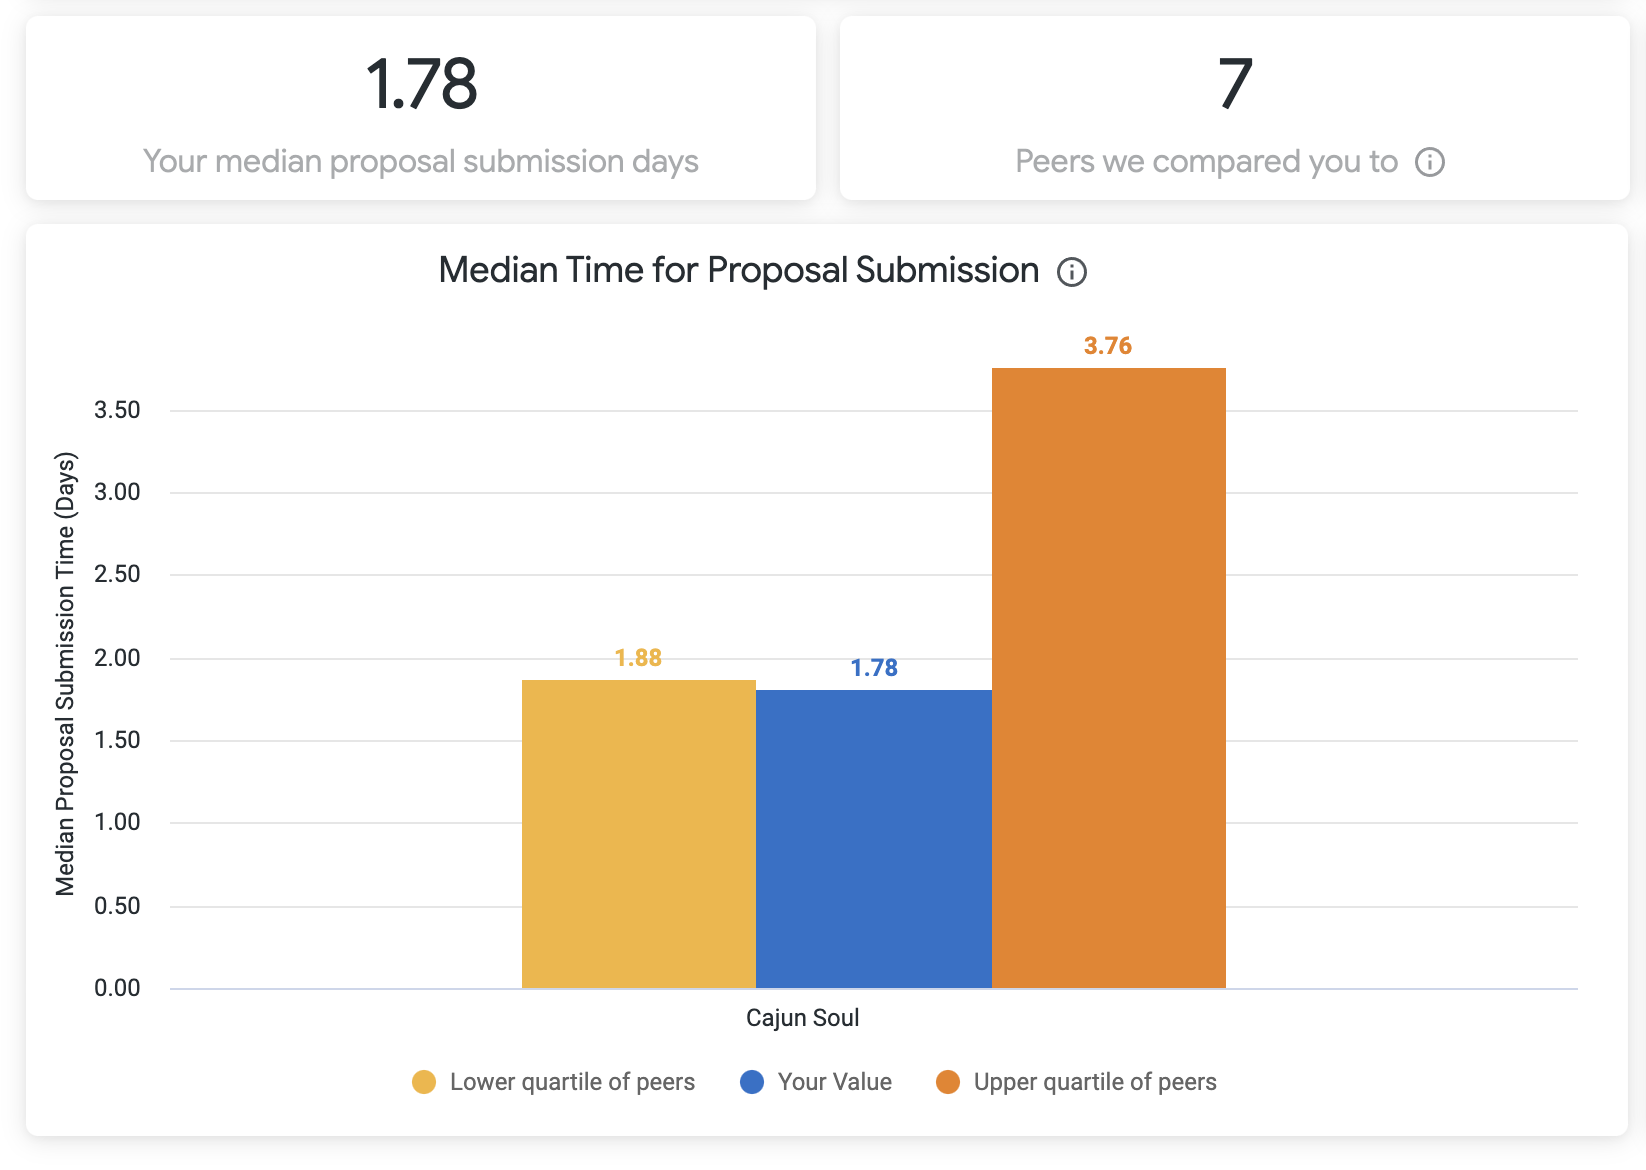
Median proposal submission time is calculated by the difference between WAITING FOR QUOTE and WAITING FOR APPROVAL status. |
| Section | ||||||||||
|---|---|---|---|---|---|---|---|---|---|---|
|
| Note | ||
|---|---|---|
| ||
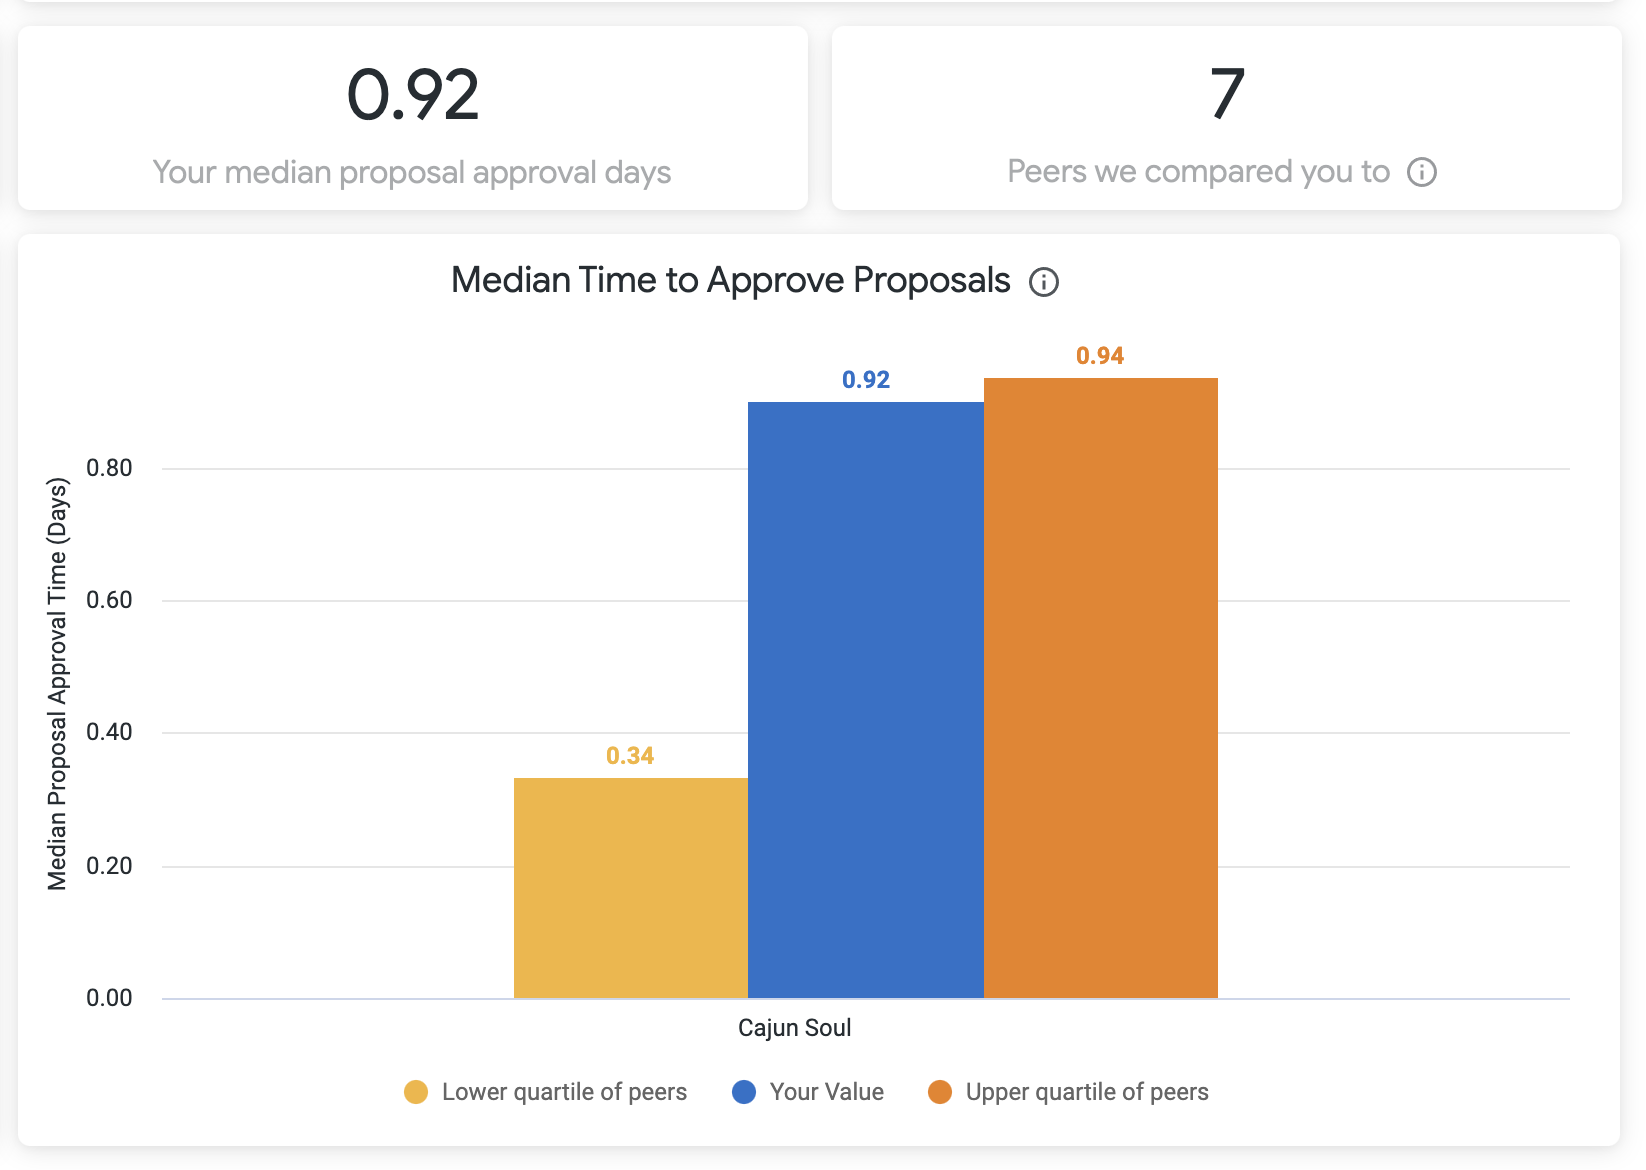
Median proposal approval time is calculated by the difference between WAITING FOR APPROVAL and PROPOSAL APPROVED status. |
Anchor commondatafeatures commondatafeatures
Insert excerpt All Calls Tab All Calls Tab nopanel true
| Live Search | ||||||||
|---|---|---|---|---|---|---|---|---|
|
| Panel | ||||||||
|---|---|---|---|---|---|---|---|---|
| ||||||||
|

| Panel | ||||||||||||
|---|---|---|---|---|---|---|---|---|---|---|---|---|
| ||||||||||||
|