The Priority Analysis tab allows you to review your spend, aging and distribution of invoices, work orders, and committed spend, by Priority. See your facilities budget allocation over the past 365 days, by default, or use the all-inclusive filters along along the top of the report to change the date range, or to focus on specific Trades, Categories, and/or Location information (Region, District, or specific Location).
The visualizations in this report are:
- Invoice Analysis by Priority
- Work Order Count by Priority
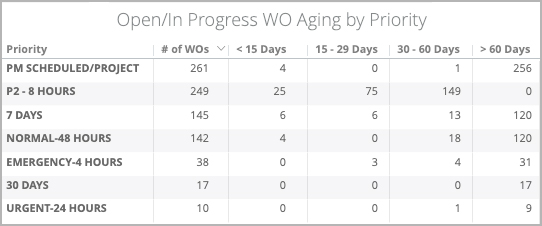
- Open/In Progress Work Order Aging by Priority
- Committed Spend by Priority by Month
You can download the data for each visualization and email reports to recipients.

Anchor invanalysis invanalysis
Invoice Analysis by Priority
| invanalysis | |
| invanalysis |
| Section | ||||||||||||
|---|---|---|---|---|---|---|---|---|---|---|---|---|
|


Anchor wocount wocount
Work Order Count by Priority
| wocount | |
| wocount |
| Section | ||||||||||
|---|---|---|---|---|---|---|---|---|---|---|
|

Anchor woaging woaging
Open/In Progress Work Order Aging by Priority
| woaging | |
| woaging |
| Section | ||||||||||||
|---|---|---|---|---|---|---|---|---|---|---|---|---|
|
Anchor commspend commspend
Committed Spend by Priority by Month
| commspend | |
| commspend |
 Committed Spend combines 2 pieces of data:
- Total Invoice Amount for work orders with Approved invoices; and
- NTE Amount for work orders with no Approved invoices
Work orders with an invoice in the Open or On Hold statuses will calculate under the NTE Amount.
Info Both voided work orders and work orders with an empty Status are excluded.
This visualization shows the Committed Spend for each month, broken down by Priority within each stacked bar.
Hover over each color of the bar to view the Priority and the Committed Spend for that Priority for that month. Click each bar to drill down into all underlying data, or filter by Trade or Call Date.
By default, this chart displays this data over the past 365 days; use the all-inclusive filters along the top of the report to change the date range.
| Anchor | ||||
|---|---|---|---|---|
|
| Insert excerpt | ||||||
|---|---|---|---|---|---|---|
|
| Live Search | ||||||||
|---|---|---|---|---|---|---|---|---|
|
| Panel | ||||||||
|---|---|---|---|---|---|---|---|---|
| ||||||||
|
| Panel | ||||||||||||
|---|---|---|---|---|---|---|---|---|---|---|---|---|
| ||||||||||||
|