The Asset Analytics Dashboard allows users to analyze spend, condition, work order history and resolution time of assets.
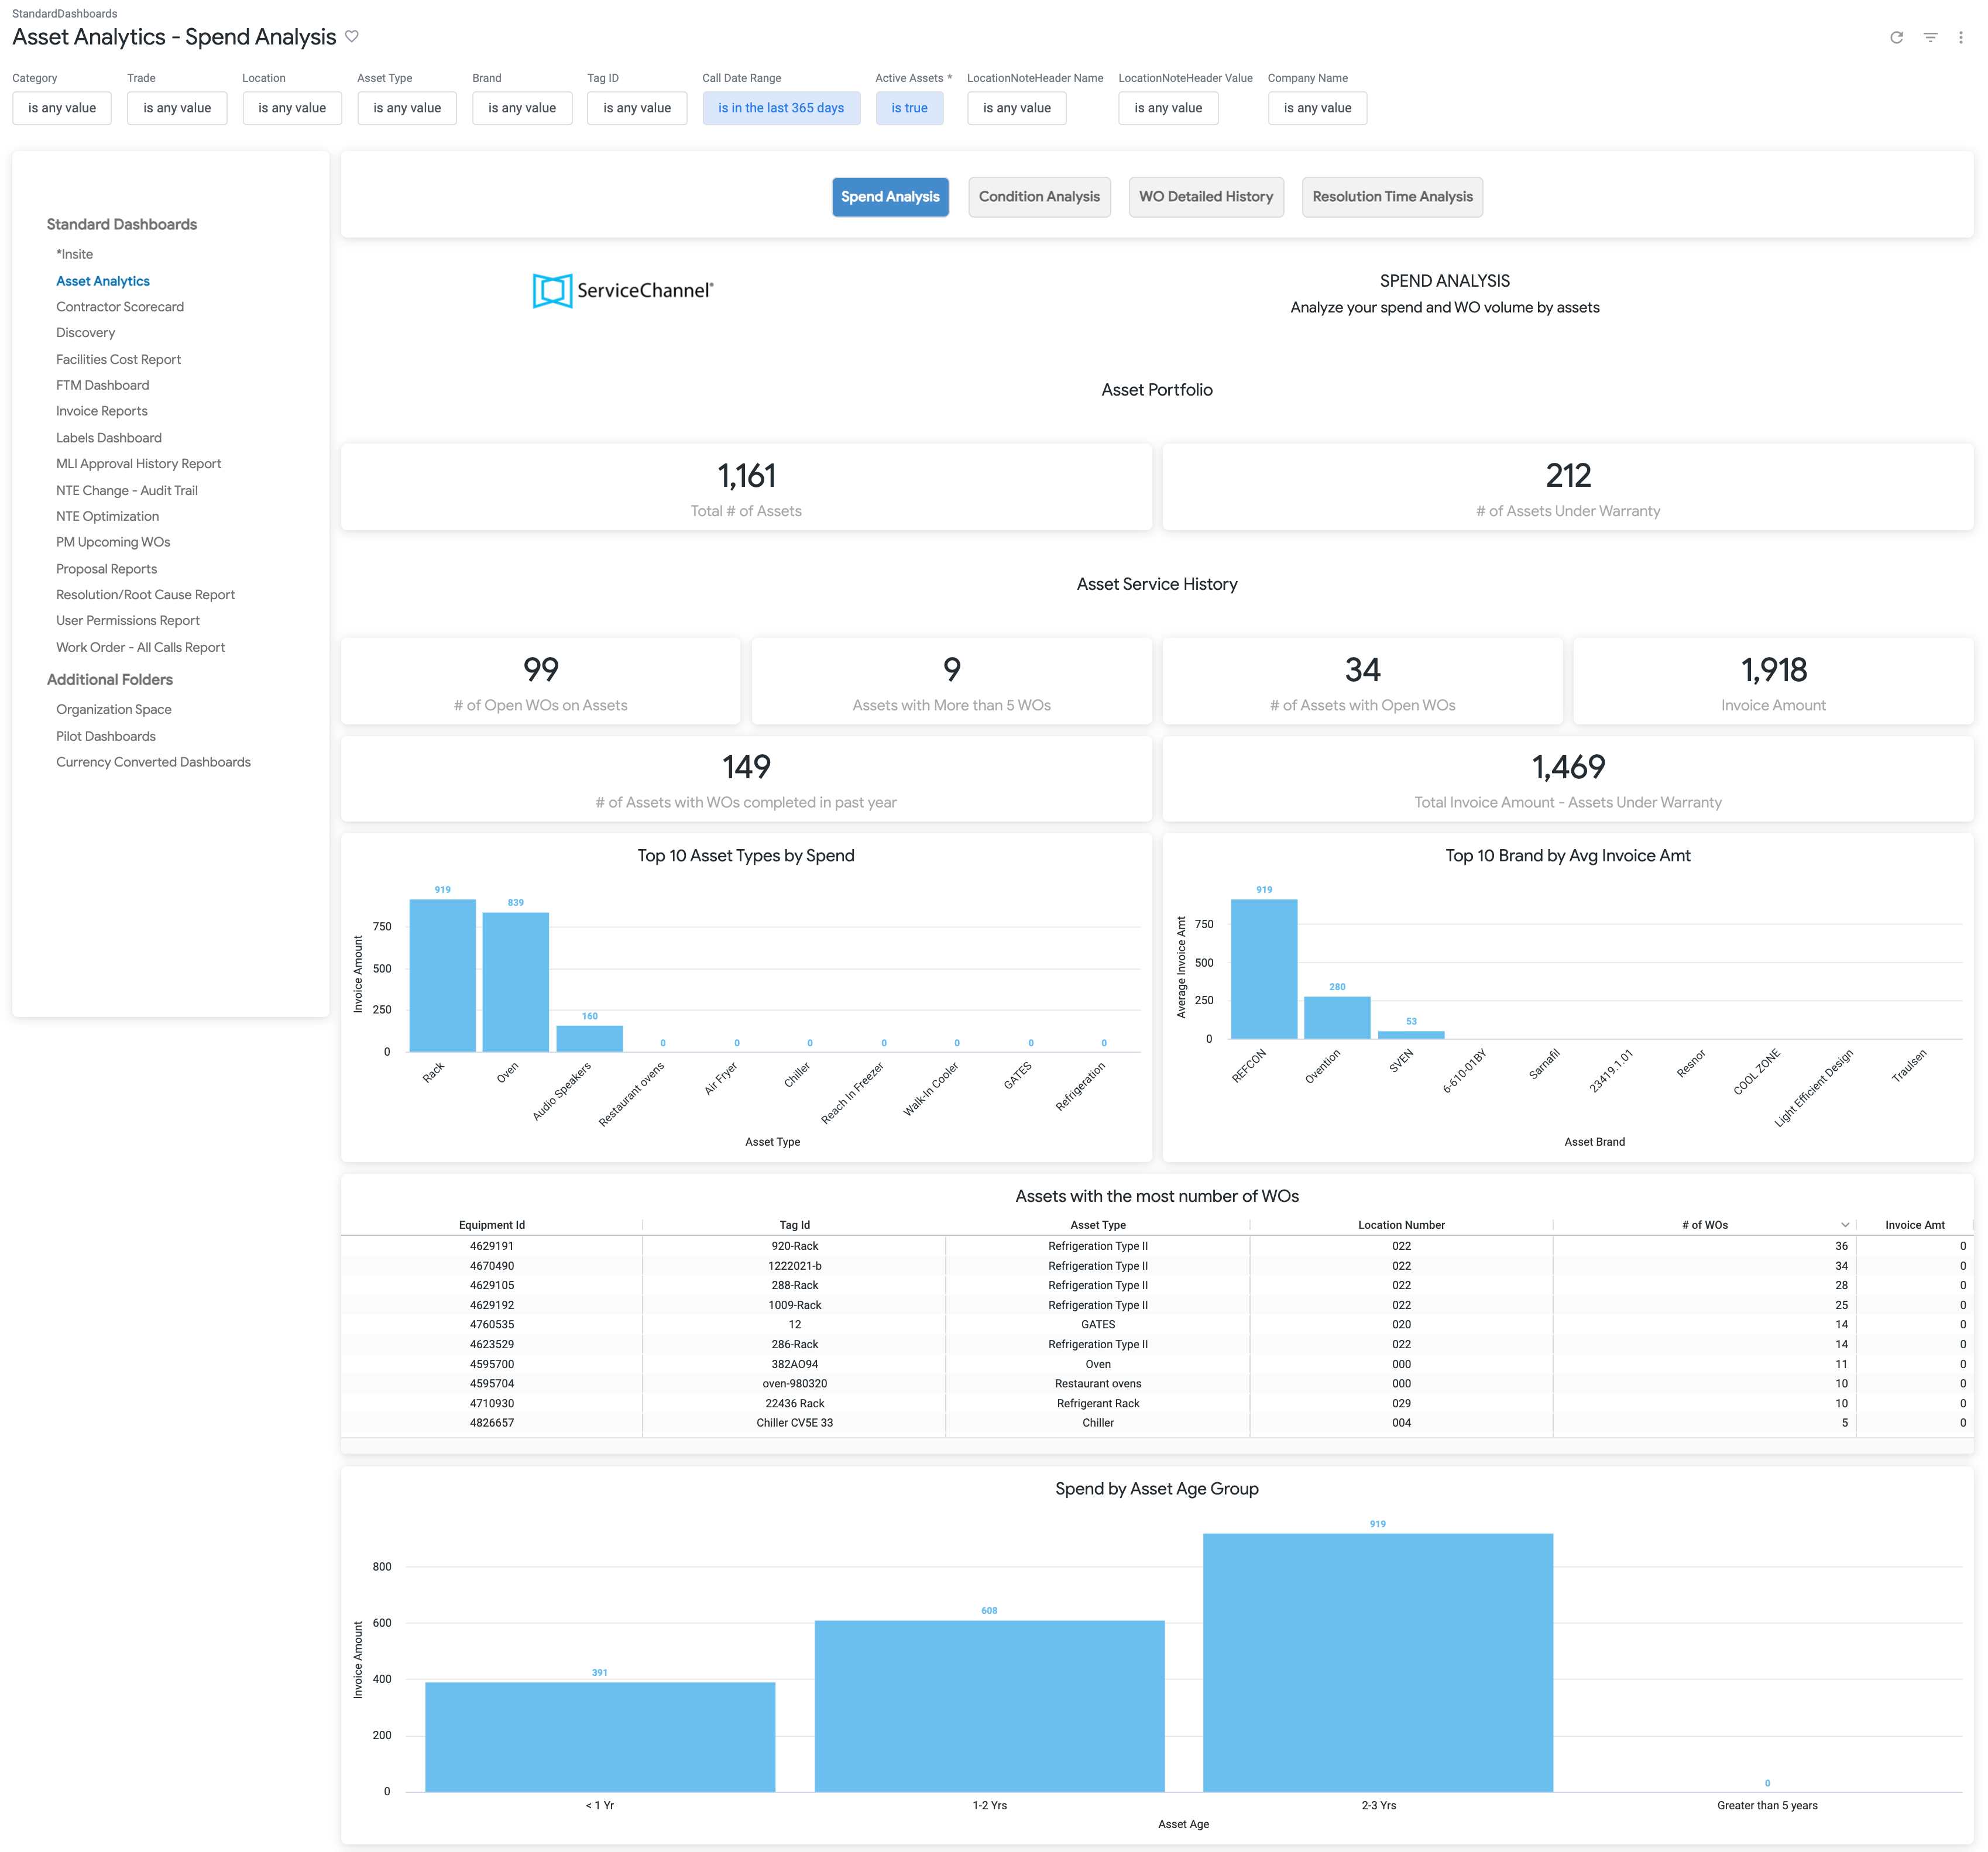 Image Removed
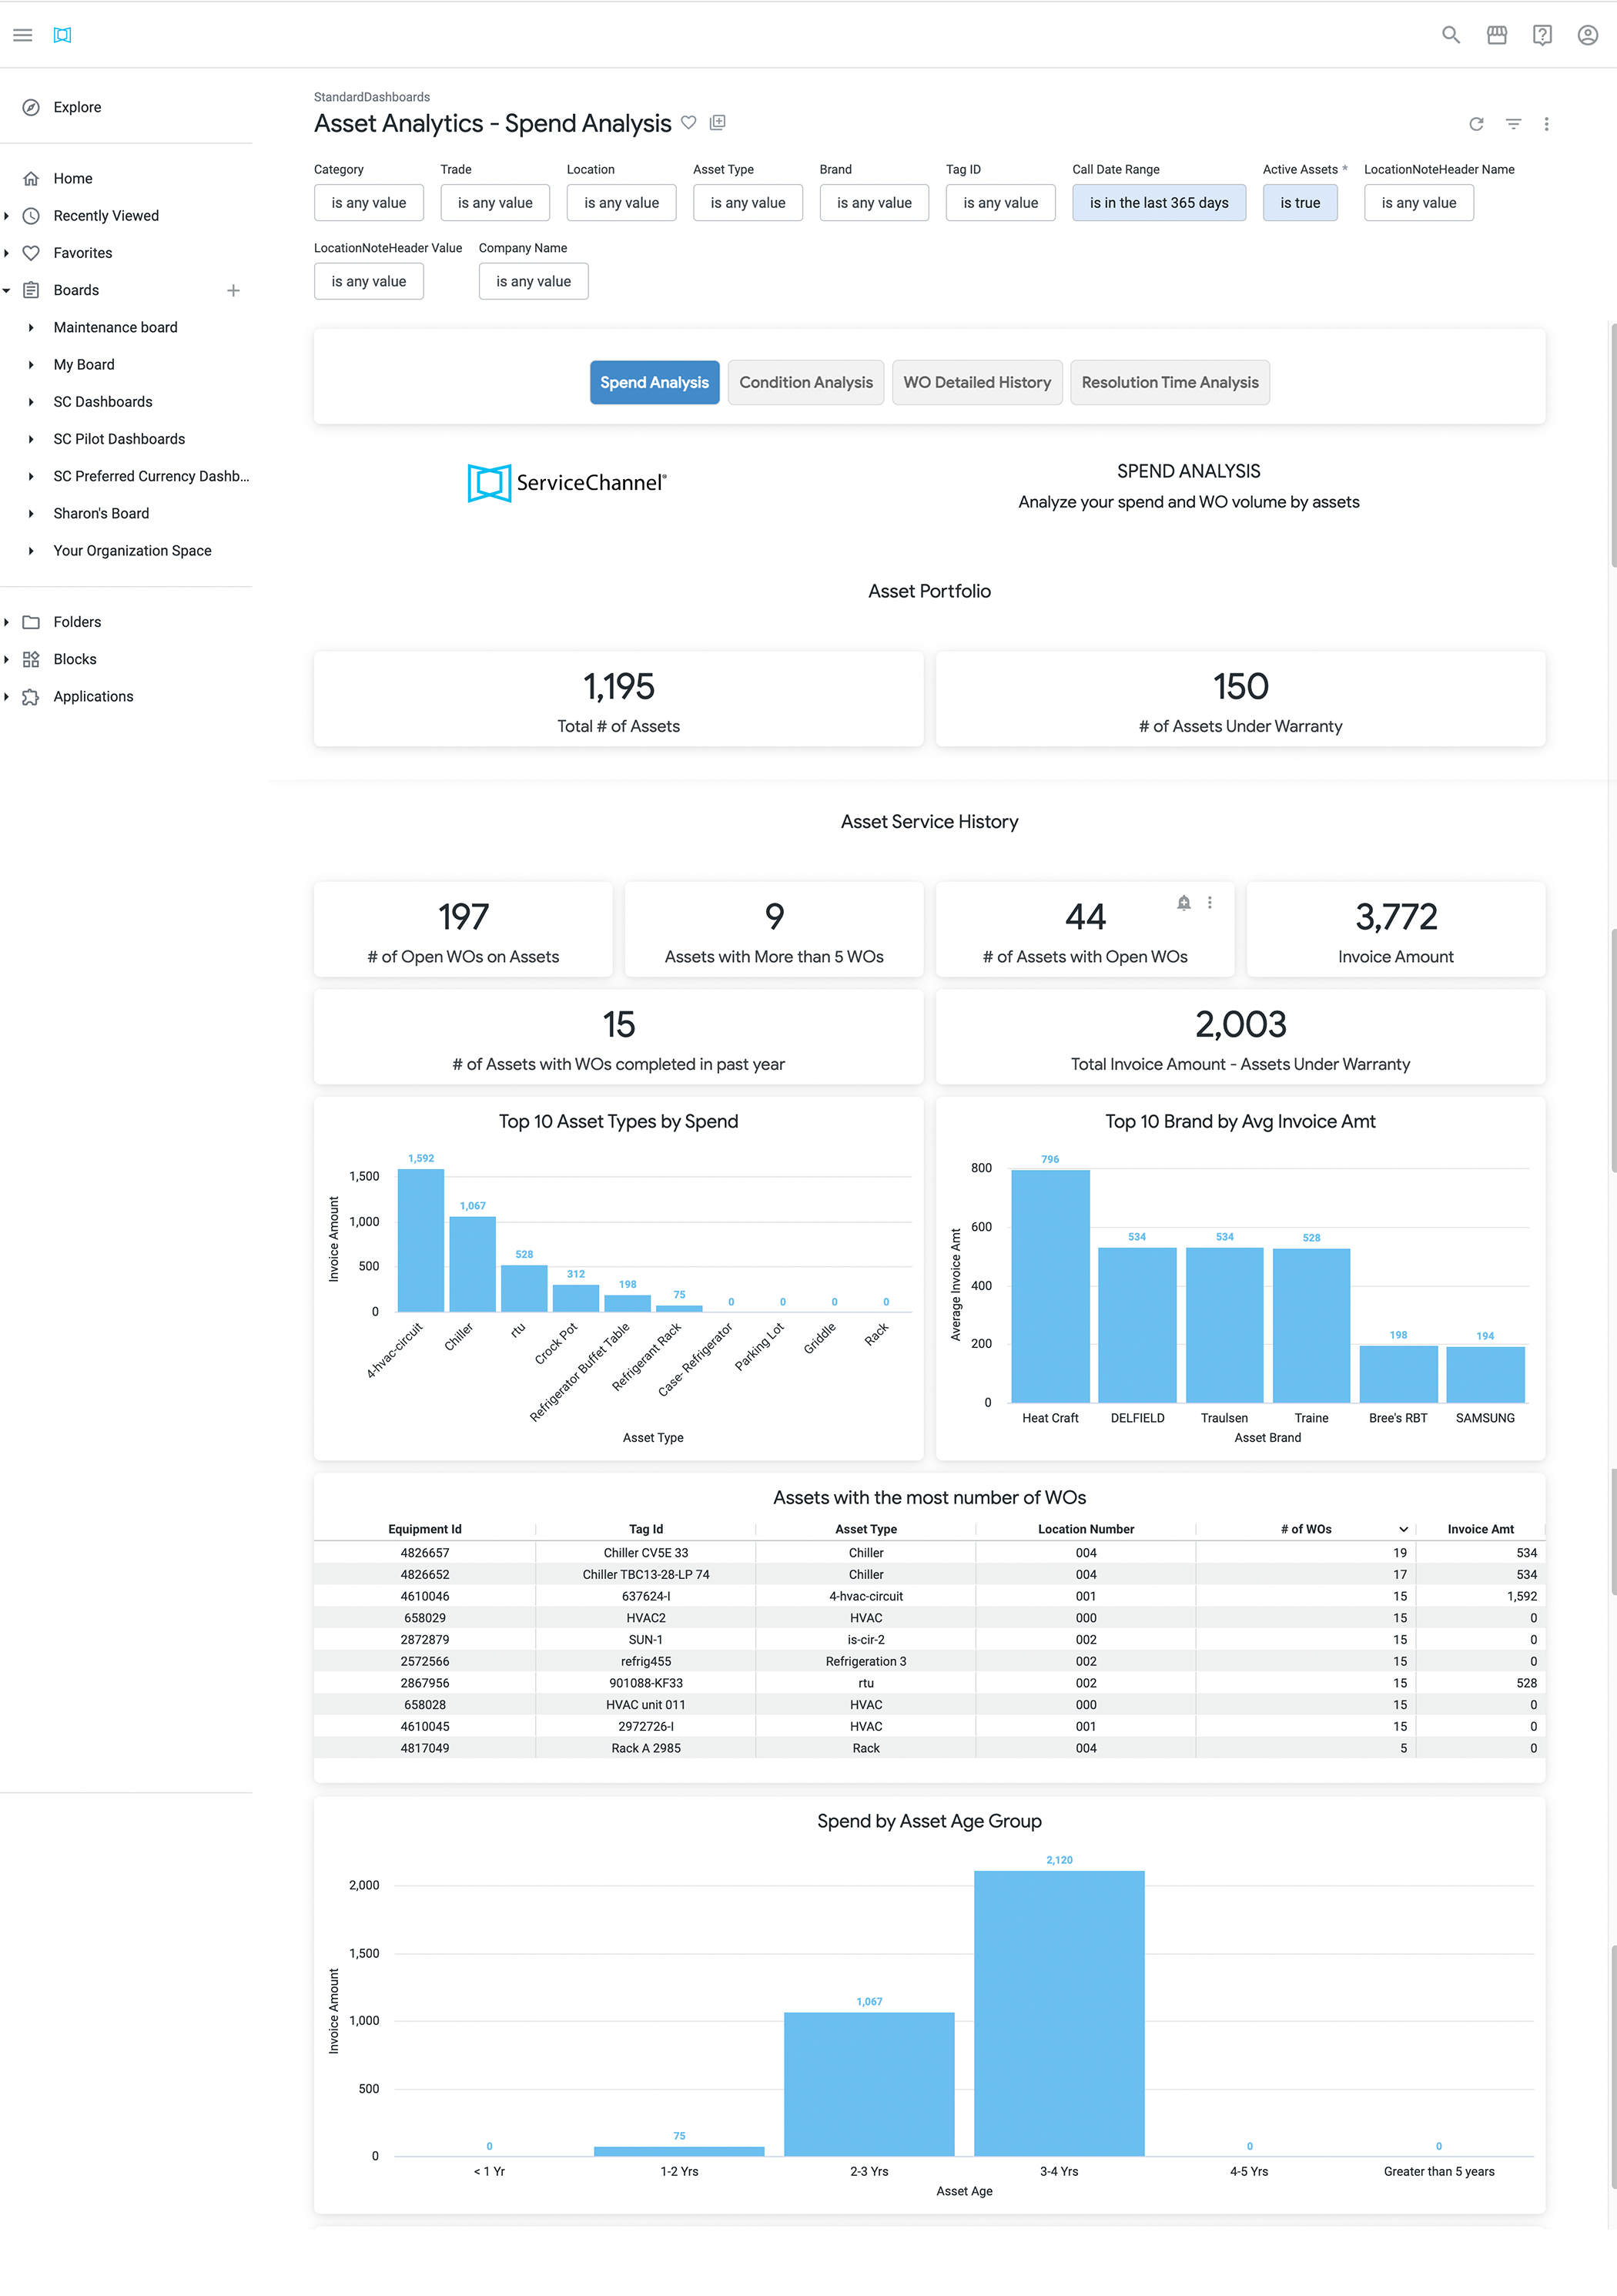 Image Added
Reports Available in this Dashboard
When you access the report you will see 4 tabs:
- The Spend Analysis tab opens by default, displays spend and work order volume by assets.
- The Condition Analysis tab displays the condition of assets, warranty status and whether a repair or replacement may be necessary.
- The WO Detailed History tab displays in-depth work order history of any repairs of assets.
- The Resolution Time Analysis tab displays the resolution time in days from the creation of the work order to completion.
