Benchmarking Dashboard
Benchmarking Dashboard is the latest addition in Contractor Scorecard 2.0 that empowers you to gain insightful perspective into your performance and make data-driven decisions. This feature is designed to validate your performance in an industry where excellence matters. The Benchmarking Dashboard offers a comprehensive breakdown of performance by delving into each performance category's Key Performance Indicators (KPIs), allowing you to gain a genuine comparison of your performance to your true peers, while also providing visibility into your position within the broader ServiceChannel platform. By categorizing performance into four tiers – bottom, below average, average, and top – you can now gauge your standing accurately.
These performance tiers serve as a valuable tool, offering insights into the entire spectrum of performance. Whether you're on the verge of advancing to the next tier with only minor adjustments or you're consistently delivering reliable performance, the data range provides context to your overall performance. If the range is wide, it signifies significant room for performance improvement, which can be an instrumental point of discussion during performance reviews. If you were ever curious about your Search rankings, now you have unparalleled opportunity to assess your standing and explore avenues for improvement. This dashboard serves as a vital resource for gaining a holistic view of your performance, reinforcing your position, and ensuring that "Look ServiceChannel says I'm doing great" is not just a statement, but a reality supported by data.
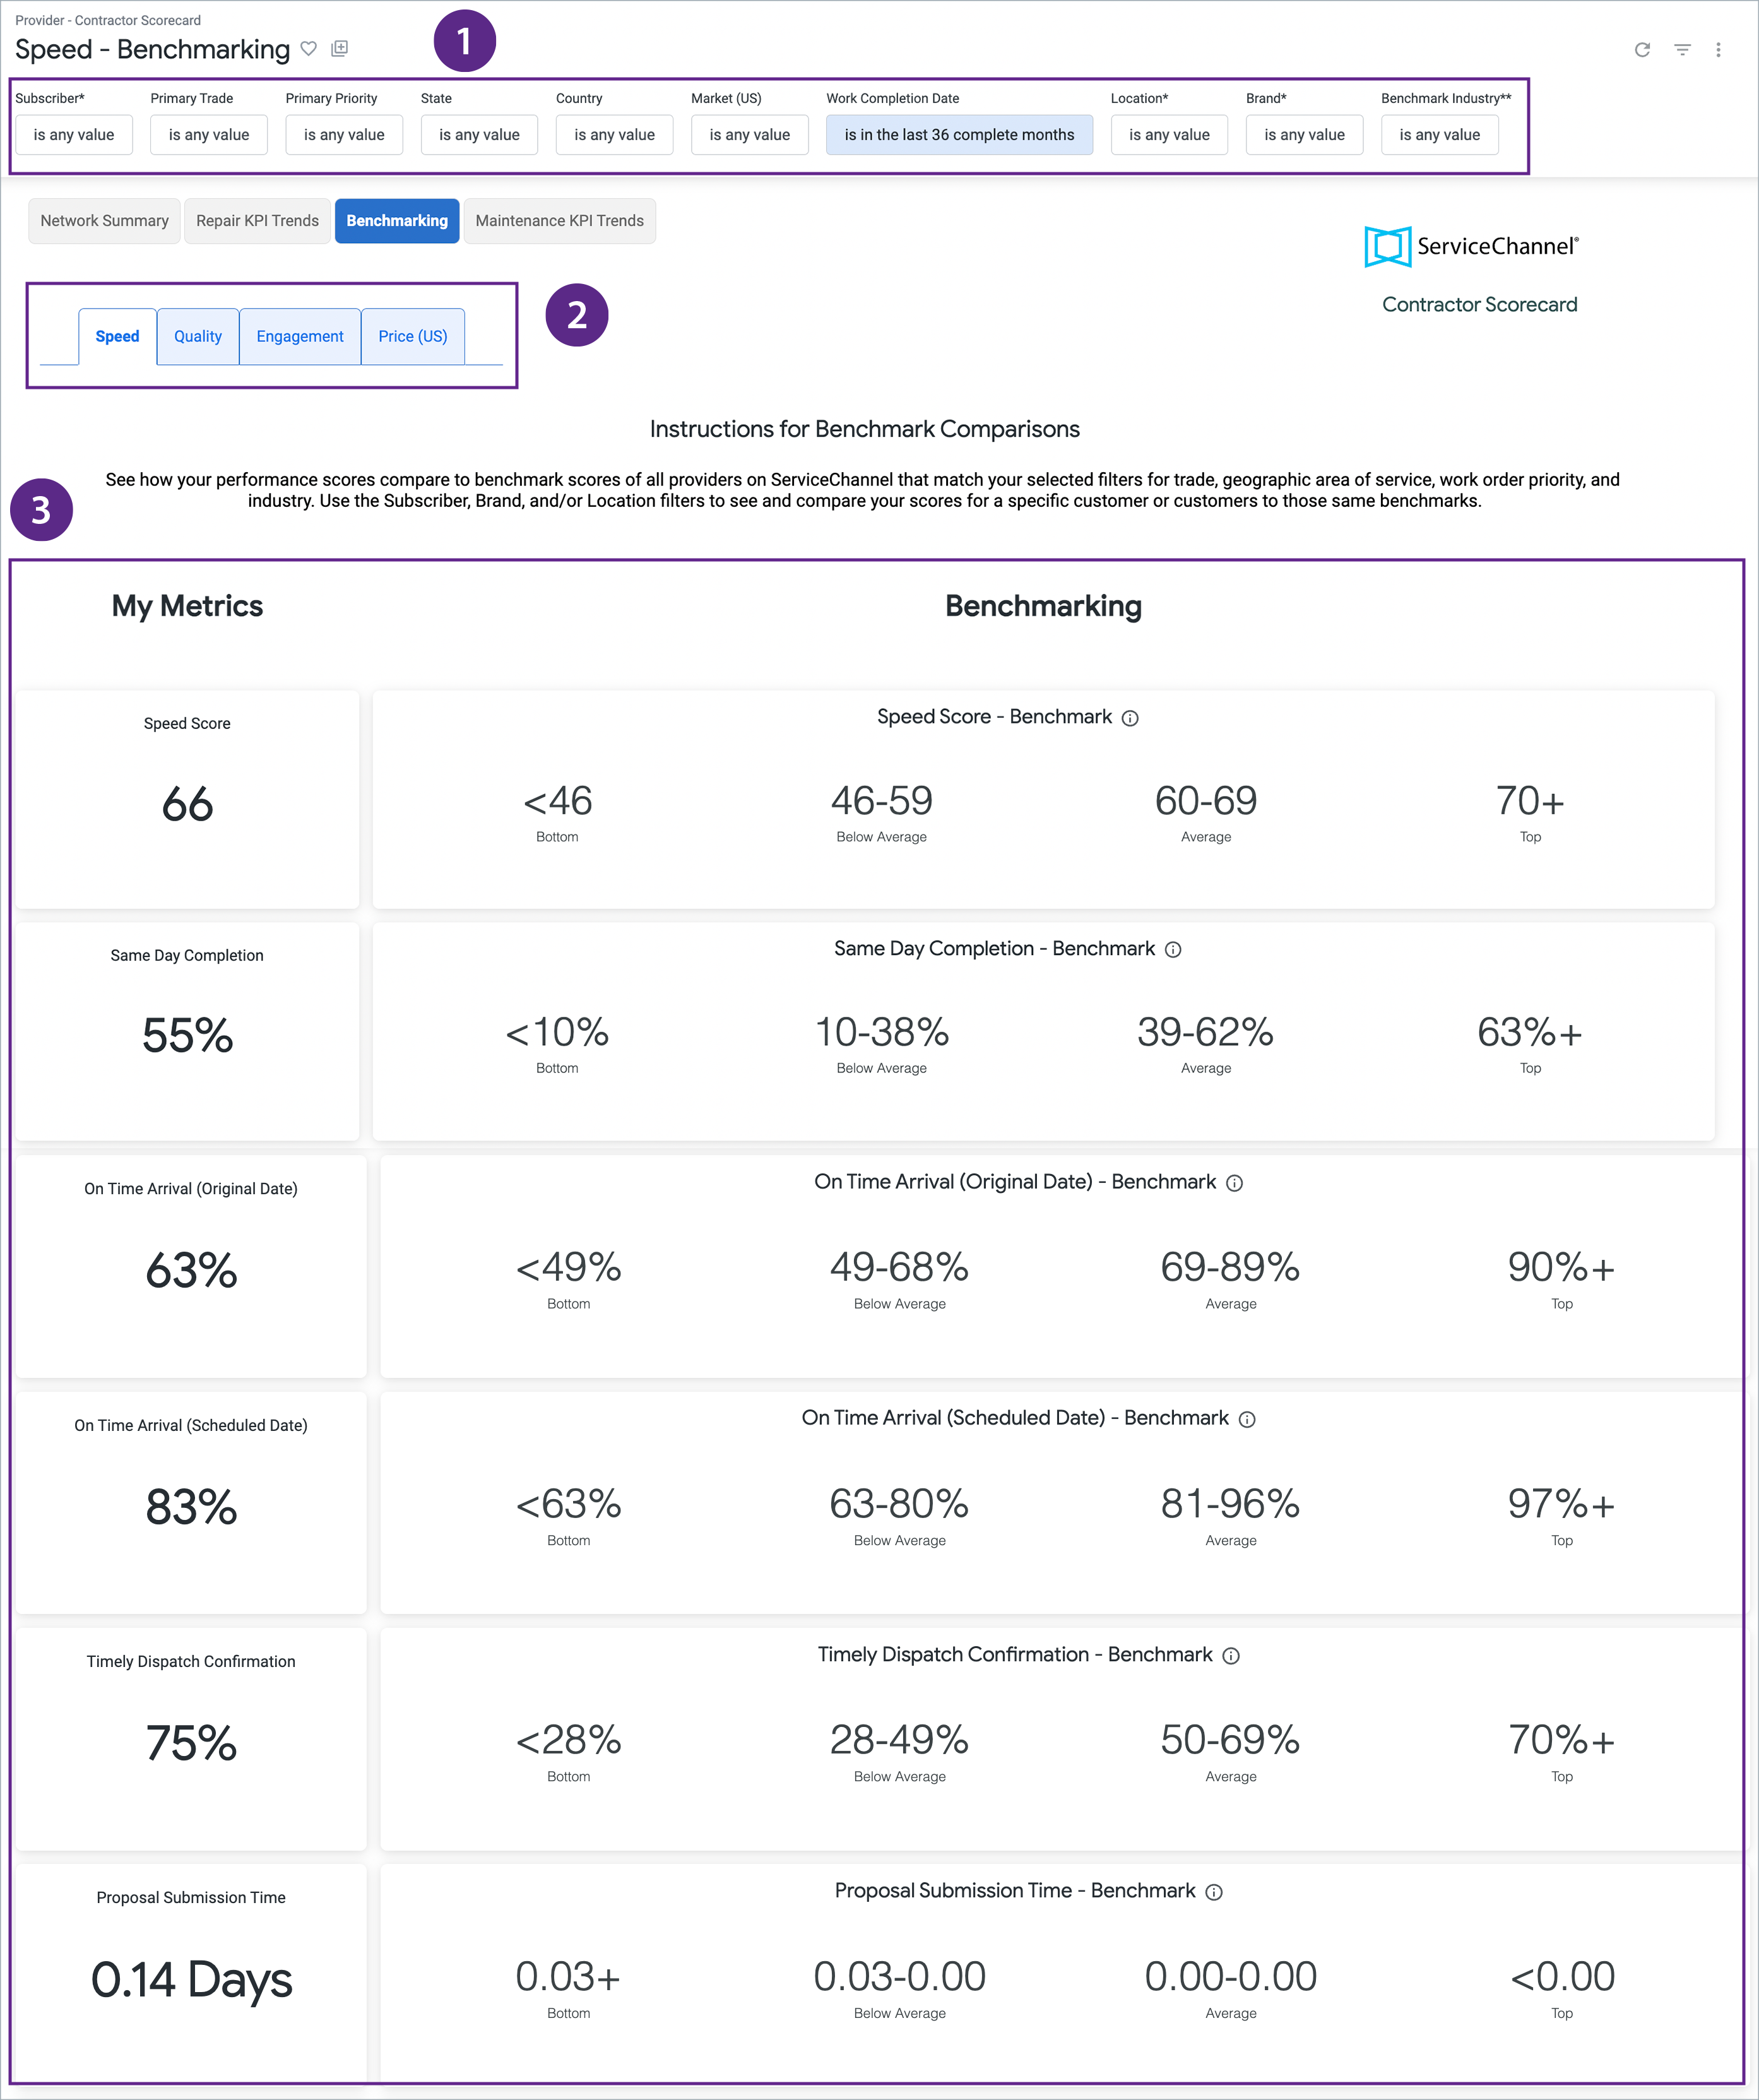
Navigating the Benchmarking Dashboard
Filters - Filters will change with every tab to only include the most relevant information for each type of report and help you filter for the most meaningful data. Pay attention as some look similar, but actually do have filters different from previous pages.
We recommend you start with filtering by trade and region to get the best comparative data.
- Performance Category Tabs - Click on each tab to get a deeper look at each performance category.
- Speed specific look at 9 speed KPIs based on repair work orders.
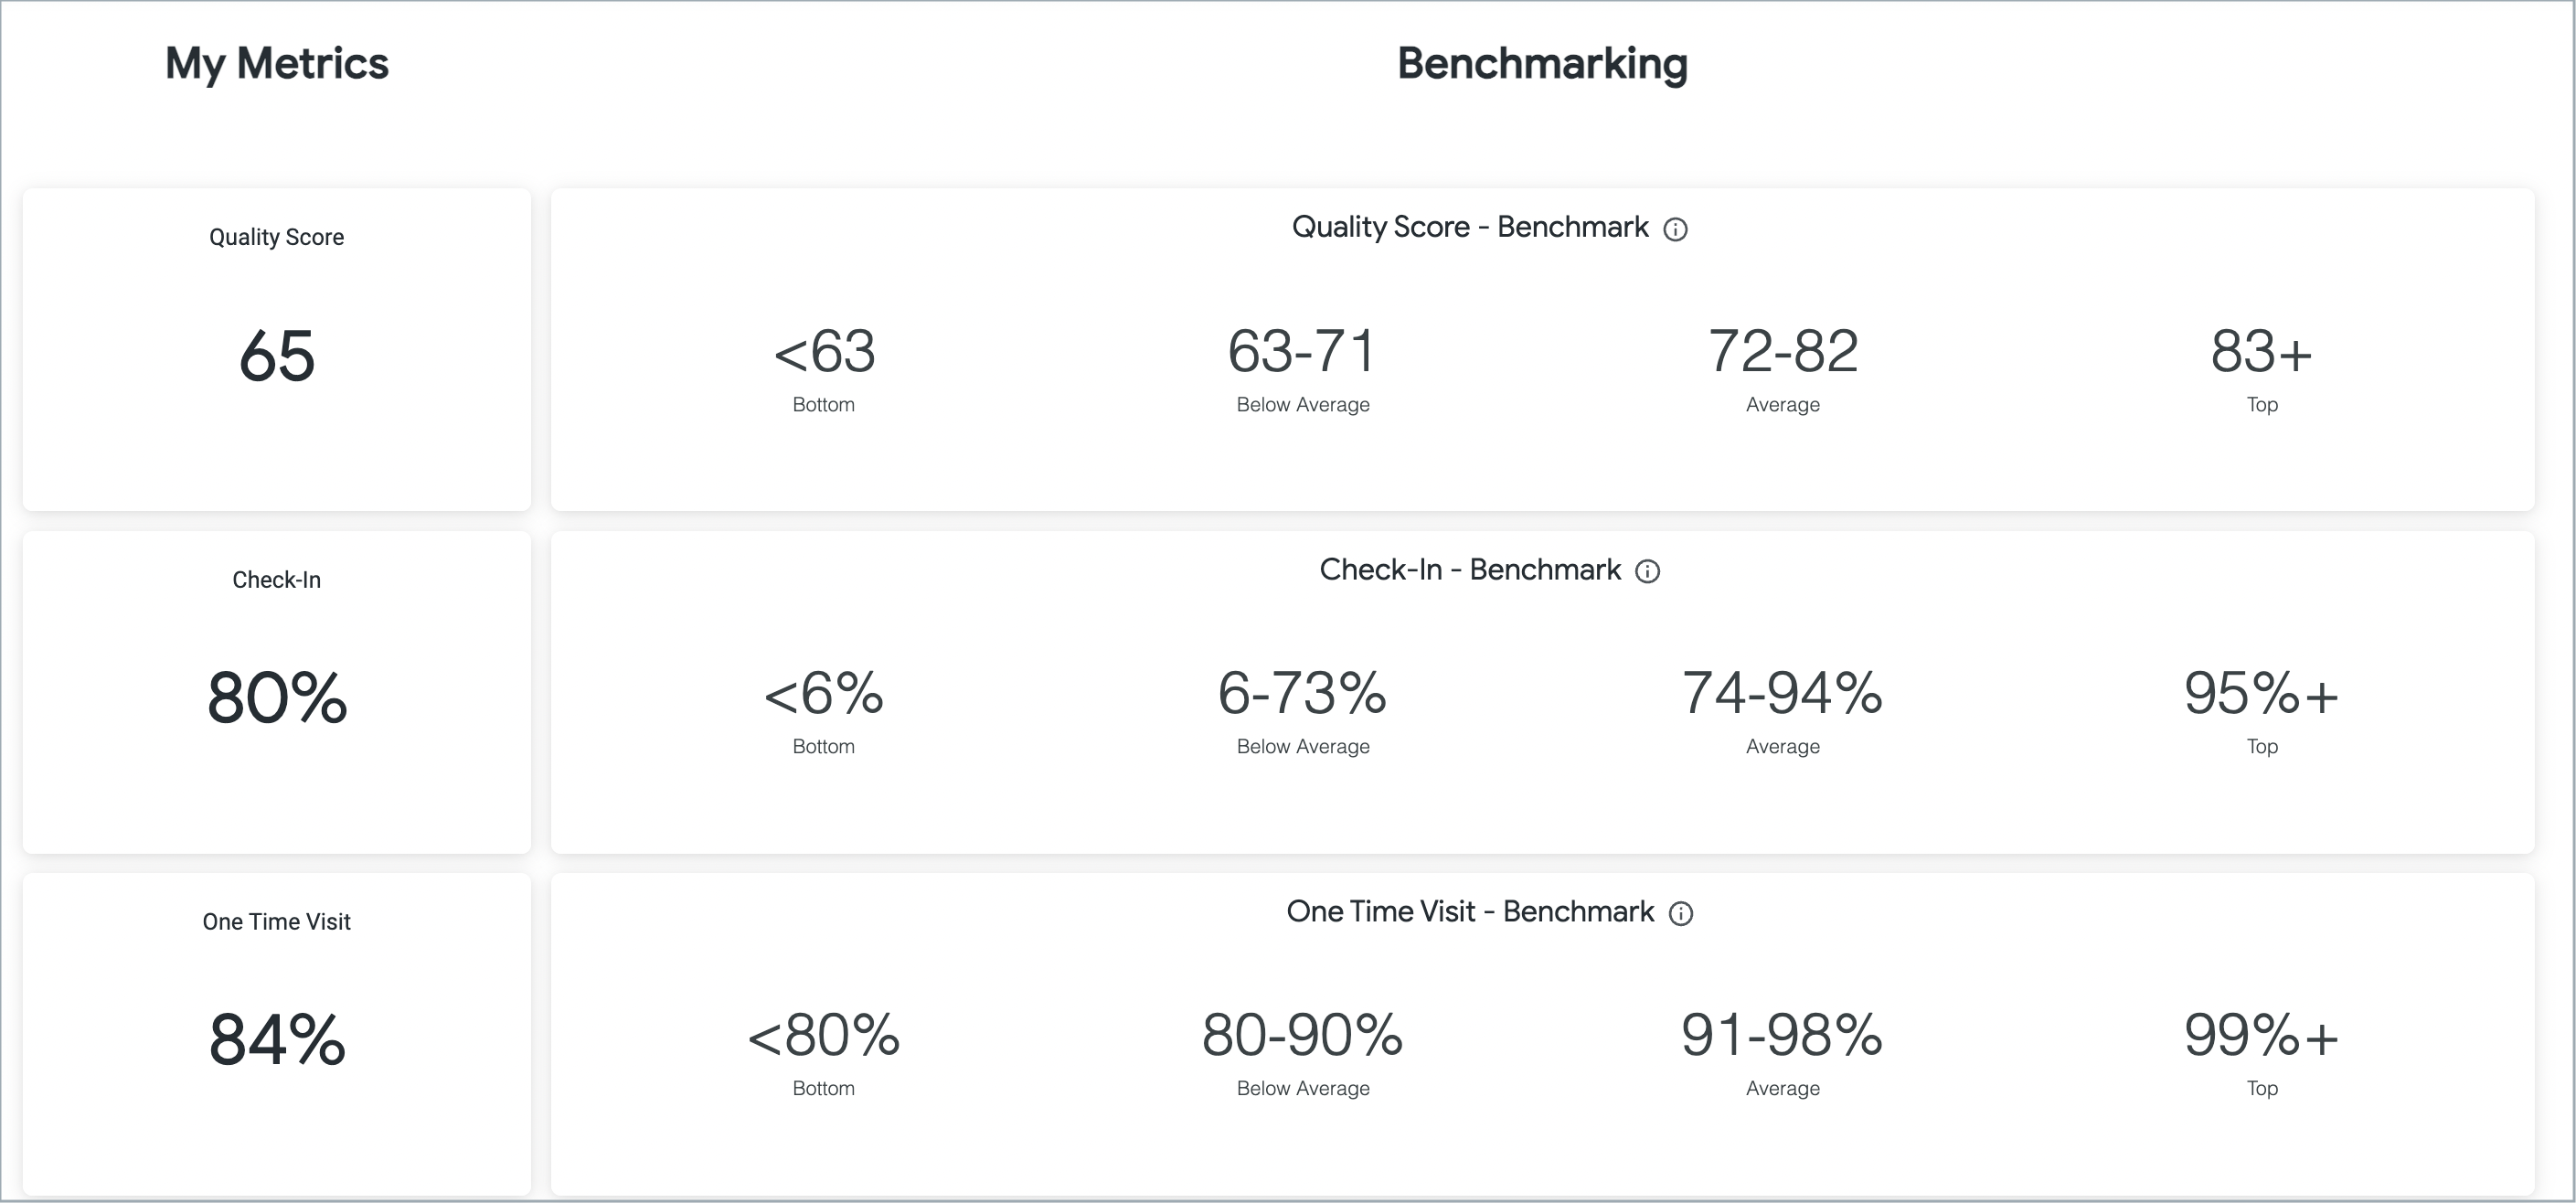
- Quality specific look at 4 quality KPIs based on repair work orders.
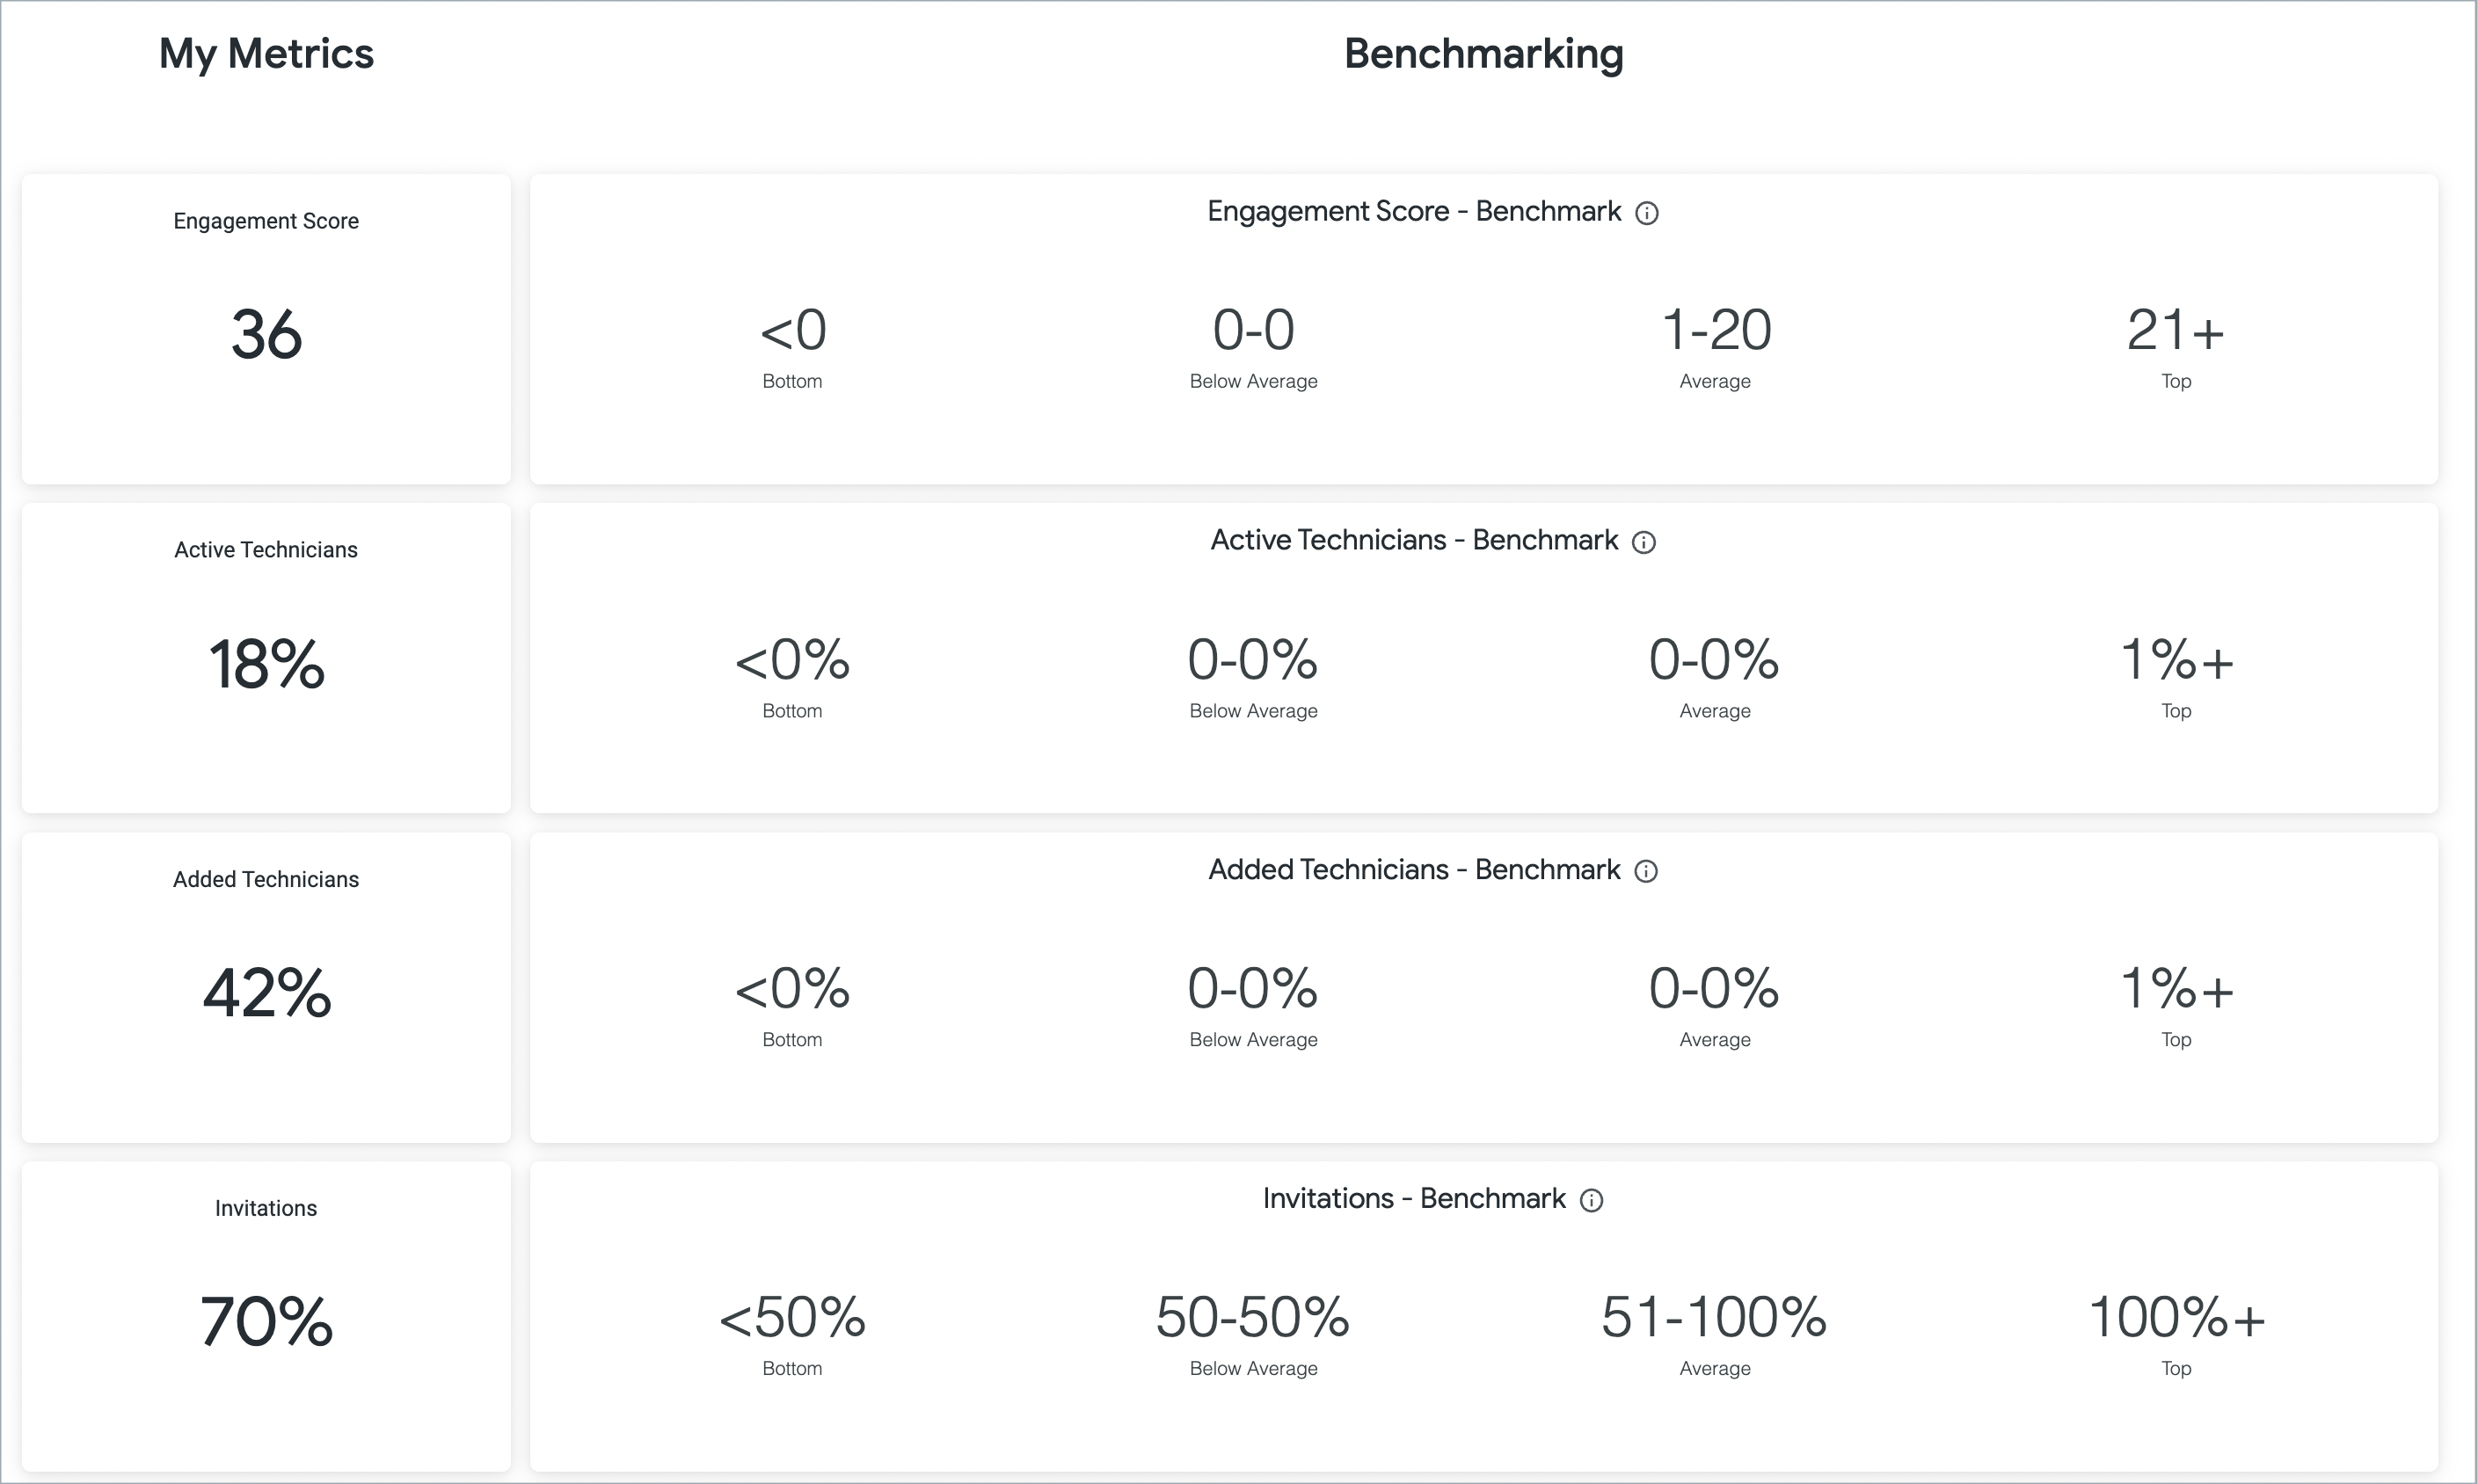
- Engagement specific look at 6 engagement KPIs primarily based on Fixxbook activities.
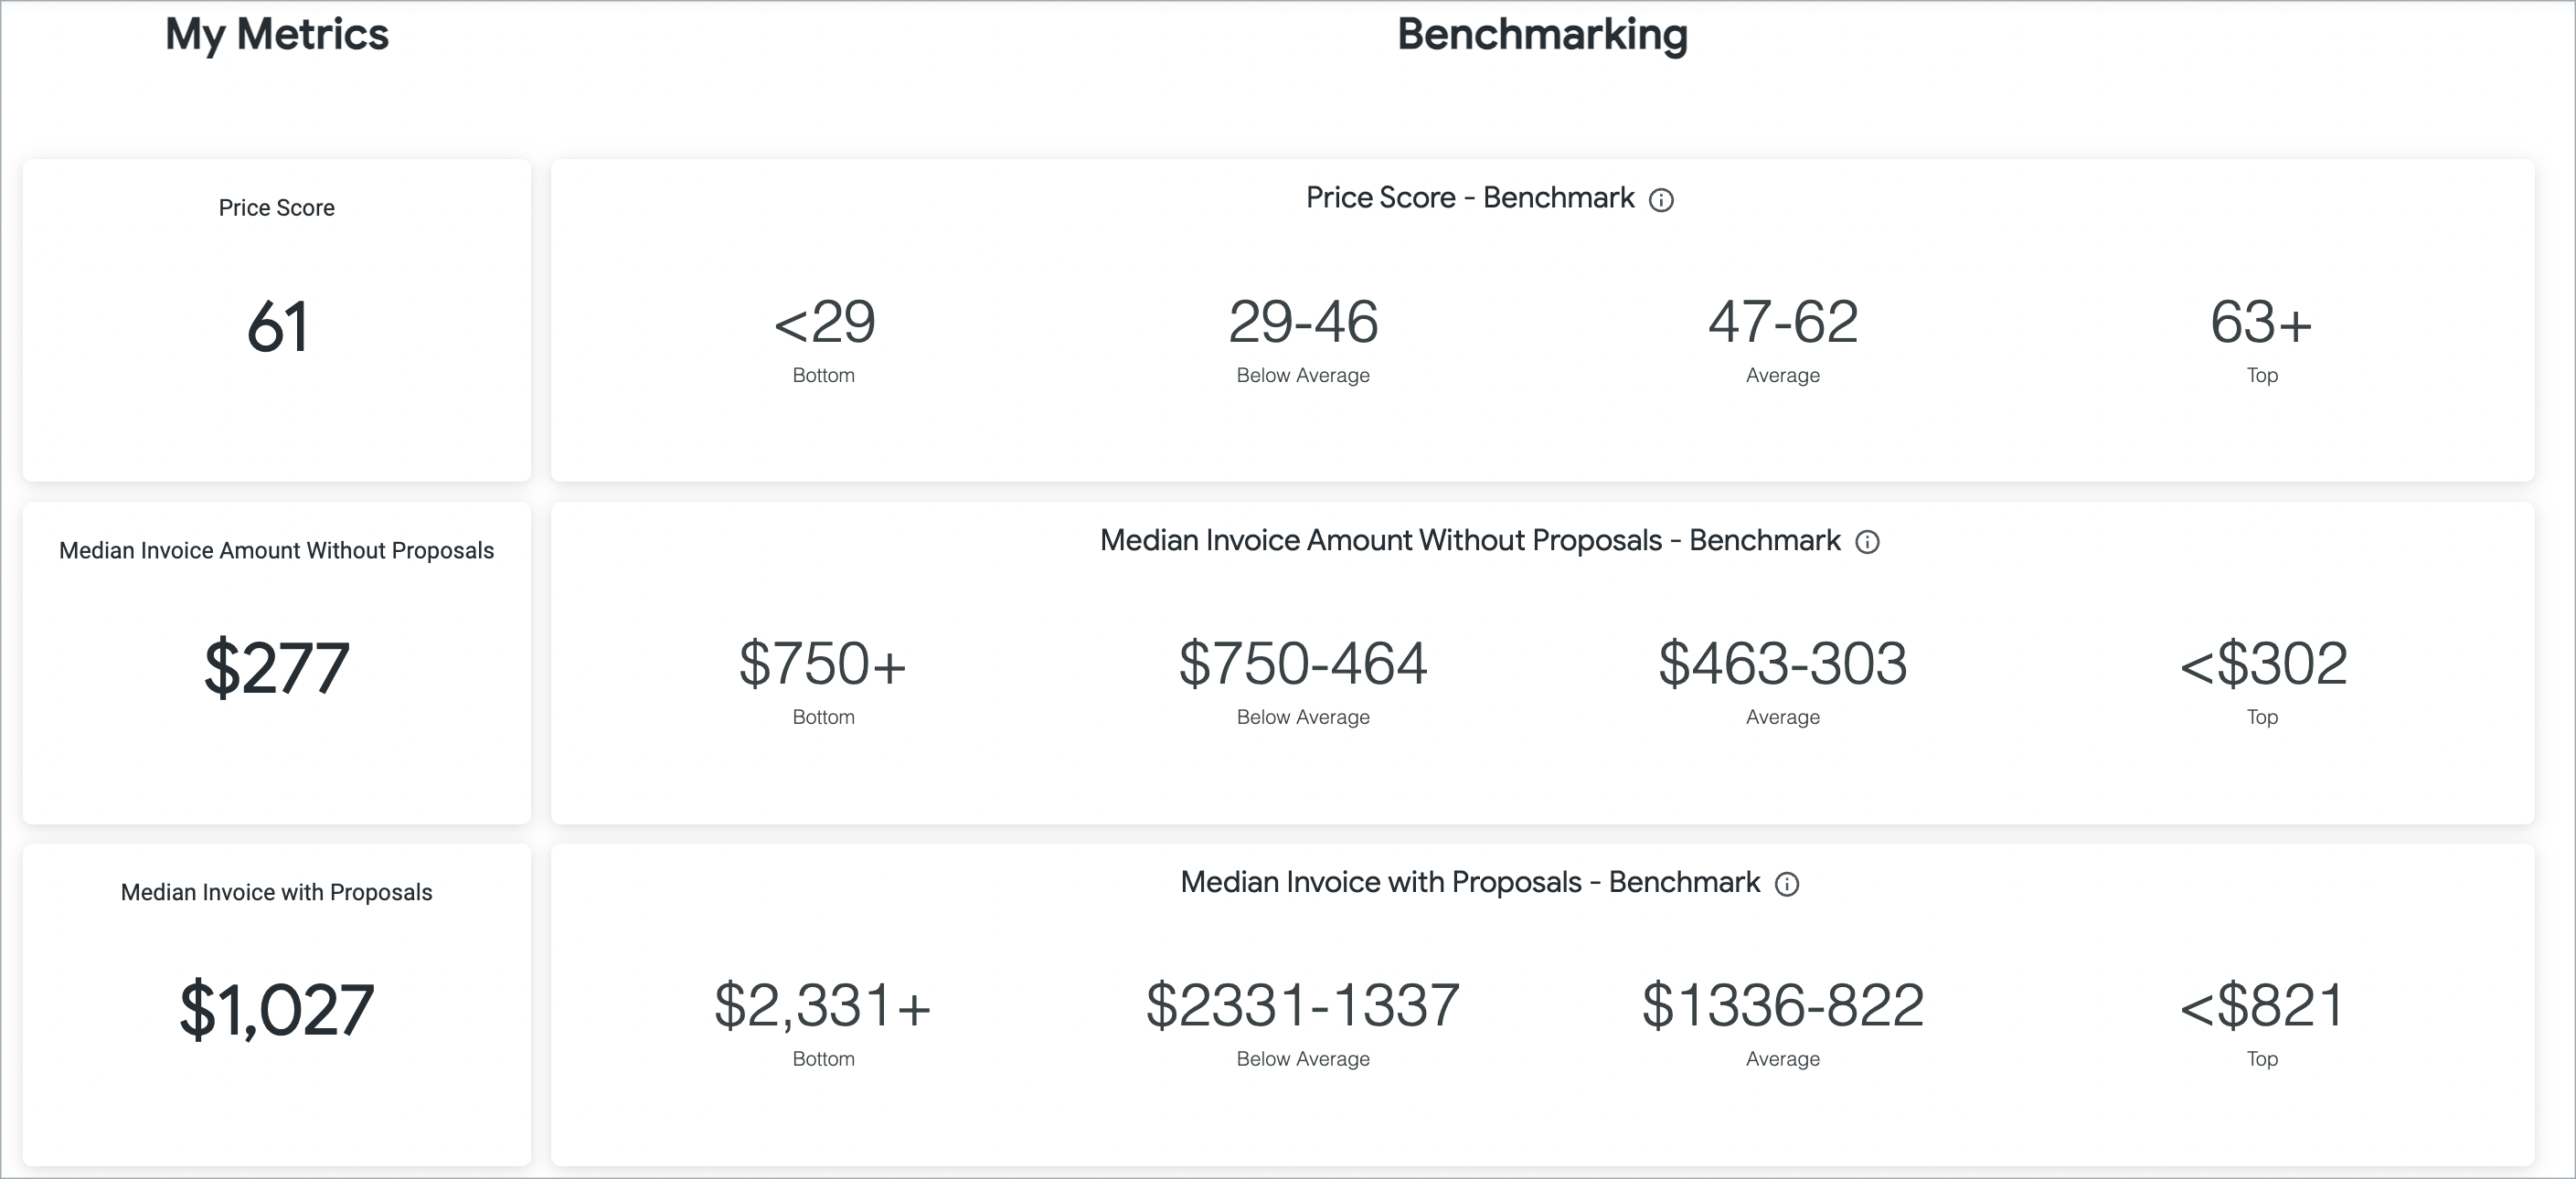
- Price (US) specific look at 6 price KPIs based on median invoice amounts.
- Scores and Benchmark Performance Tiers - View each KPI score against the benchmark for the last 36 months of data for each category and KPI. Drill in to performance scores for Speed and Quality.
Speed & Quality
Both Speed and Quality benchmarking scores have the same filters and drill in capabilities.
Filters
Refine and deepen your insights by filtering for specific subscribers, priorities, trades, geographic areas, date ranges, locations, brand/company names, and benchmark industry. The more data you are using for your comparisons, the more significant your results will be.
Filters without an * apply to both performance score and benchmarking data.
Filters with * only apply to performance scores (My Metrics column) and do not update the benchmarking column.
Filters with ** only apply to the benchmarking column and do not update performance scores (My Metrics column).
- Subscriber*: You can filter for a singular subscriber for a review or compare several subscribers.
Primary Trade: Search by one trade or several similar trades to get insight on trade specific performance.
Primary Priority: Look at scores associated with work orders of the same priority.
State: View subscribers by state(s).
- Country: View scores by countr(ies).
Market (US): Search for scores using Core Based Statistical Areas (CBSA). CBSAs are geographic regions defined by the US Office of Management and Budget that are anchored around urban centers of 10,000+ people along with adjacent counties that have strong social and economic ties to the urban center. This allows you to get a true comparison of provider performance, particularly around cost and speed, as the environment is more similar in that area. For example, if you compared cost for providers in Dallas, TX, you get a more accurate picture comparing them amongst each other than if you compared Dallas providers to Fredericksburg, TX providers.
Work Completion Date: Default state is 36 complete months. You can filter to whatever date range suits your purpose. You can not go beyond 36 months.
Location*: Filter for work performed at certain locations.
Brand*: Filter for certain brands in your portfolio.
- Benchmark Industry**: Limit performance comparisons to specific industries to get a better comparison of like performance.
Scores and Benchmark Performance Tiers
Scores displayed here are broken down into each performance category KPI. Use this data to determine specific areas of opportunity for improvement or to validate you are getting good performance for that KPI. Benchmarking data is dynamic and performance tiers will change depending on how you filter.
- Click on the overall score and a window will pop up.
- Click Show All.
- Click on the score on the KPI you would like to drill into and a window will pop up.
- Choose from:
- All - Shows both Compliant and Non-Compliant work orders
- Compliant - Shows only Compliant work orders
- Non-Compliant - Shows only Non-Compliant work orders.
To view Speed Score Calculations, jump on over to Contractor Scorecard 2.0 Calculations. To view Quality Score Calculations, jump on over to Contractor Scorecard 2.0 Calculations.
Engagement
Engagement scores are primarily based on Fixxbook activity and is calculated on the first Sunday of each month. This is the only dashboard in Contractor Scorecard 2.0 that does not have filters and will not cary based on Subscriber.
Scores and Benchmark Performance Tiers
No Drill In
This look does not have drill in capabilities as the score is an aggregate of various activities. If you are clicking and nothing is happening, that is how it is supposed to function!
To view Engagement Score Calculations, jump on over to Contractor Scorecard 2.0 Calculations.
Price (US)
Price scores are dynamic and comparative, and heavily reliant upon current marketplace data in the same trade and CBSA in order to be the most relevant.
Filters

Filters without an * apply to both performance score and benchmarking data.
Filters with * only apply to performance scores (My Metrics column) and do not update the benchmarking column.
Filters with ** only apply to the benchmarking column and do not update performance scores (My Metrics column).
Subscriber Name*: You can filter for a singular subscriber for a review or compare several subscribers.
Primary Trade: Search by one trade or several similar trades to get insight on trade specific performance.
Primary Priority: Look at scores associated with work orders of the same priority.
Market (US): Search for scores using Core Based Statistical Areas (CBSA). CBSAs are geographic regions defined by the US Office of Management and Budget that are anchored around urban centers of 10,000+ people along with adjacent counties that have strong social and economic ties to the urban center. This allows you to get a true comparison of provider performance, particularly around cost and speed, as the environment is more similar in that area. For example, if you compared cost for providers in Dallas, TX, you get a more accurate picture comparing them amongst each other than if you compared Dallas providers to Fredericksburg, TX providers.
- Benchmark Industry**: Limit performance comparisons to specific industries to get a better comparison of like performance.
Scores and Benchmark Performance Tiers
Price score benchmarking starts at Dec '22 since its inception. Eventually, 36 complete months of rolling data will show.
No Drill In
This look does not have drill in capabilities as there is not one singular factor to each KPI and overall score. If you are clicking and nothing is happening, that is how it is supposed to function!
To view Price Score Calculations, jump on over to Contractor Scorecard 2.0 Calculations.
