The Repair KPI tab shows those indicators that measures performance for your service providers on work orders in the last 365 days for repair work orders, as well as KPI trends over the past year and KPI performance per location.
On this dashboard you will see:
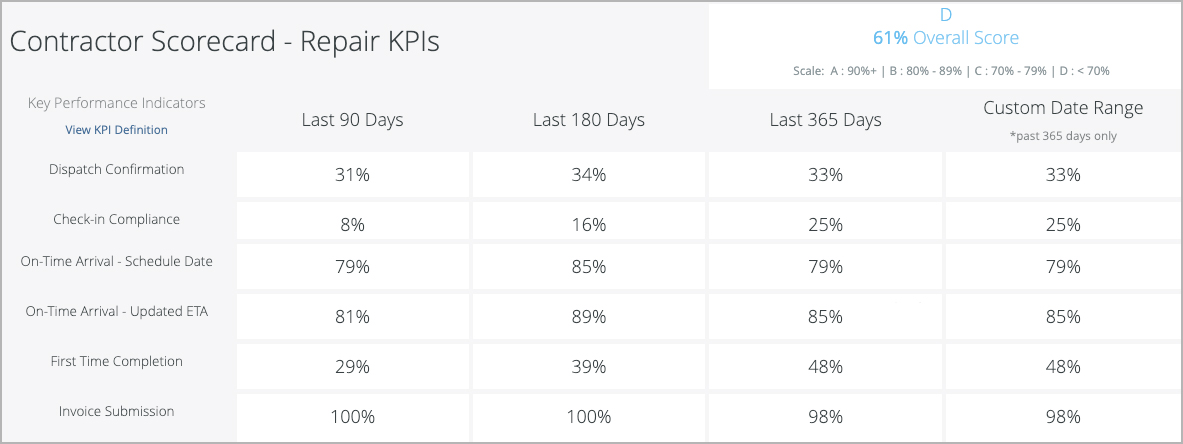
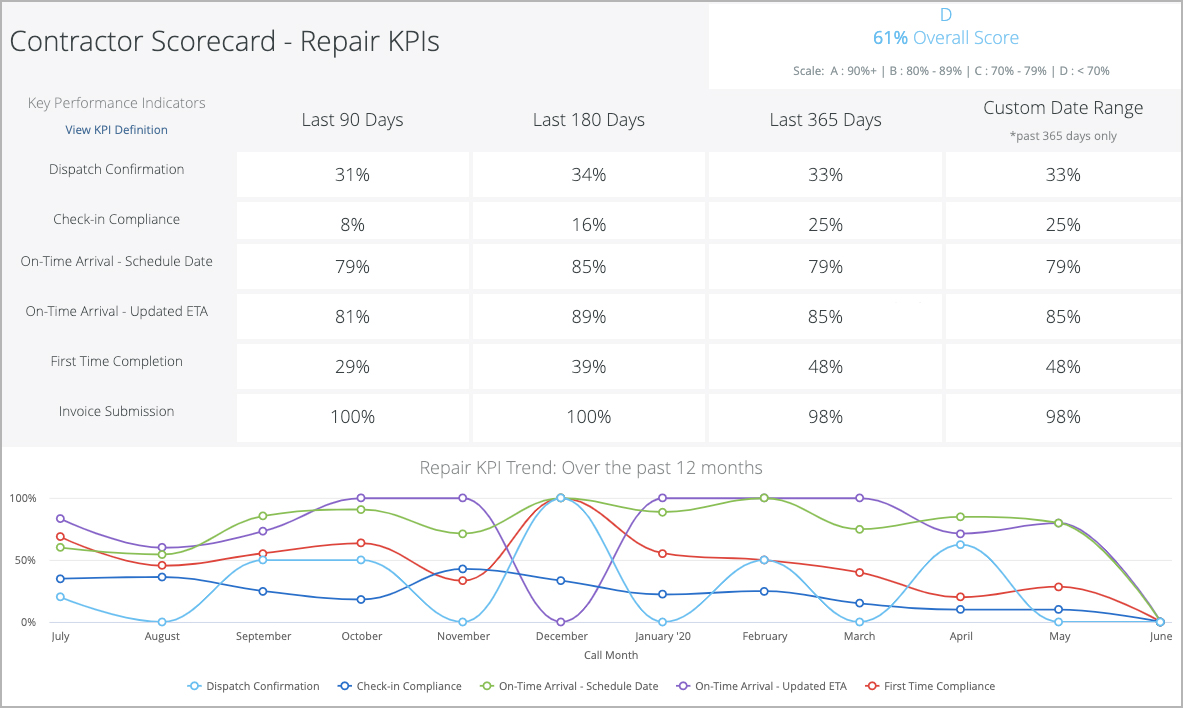
Here, you will see a matrix of Repair KPIs and the overall performance of providers over the past 90 days, 180 days, 365 days, or a custom date range under 365 days.
There are 6 Repair KPIs:
Briefly, each KPI has a calculated Score, which is the percentage of work orders that meet the criteria for that KPI:
Individual KPI Score (%) = Number of Compliant Work Orders ÷ Total Work Orders
(rounded to the nearest whole number)
The sum of all KPI Scores gives an Overall Score:
Overall Score = Sum of all KPI scores ÷ Total number of eligible KPIs
The Overall Score is then mapped to a Grade, which represents overall performance.
| Anchor |
|---|
| repairkpitrend |
|---|
| repairkpitrend |
|---|
|
Repair KPI Trend: Over the Past 12 Months
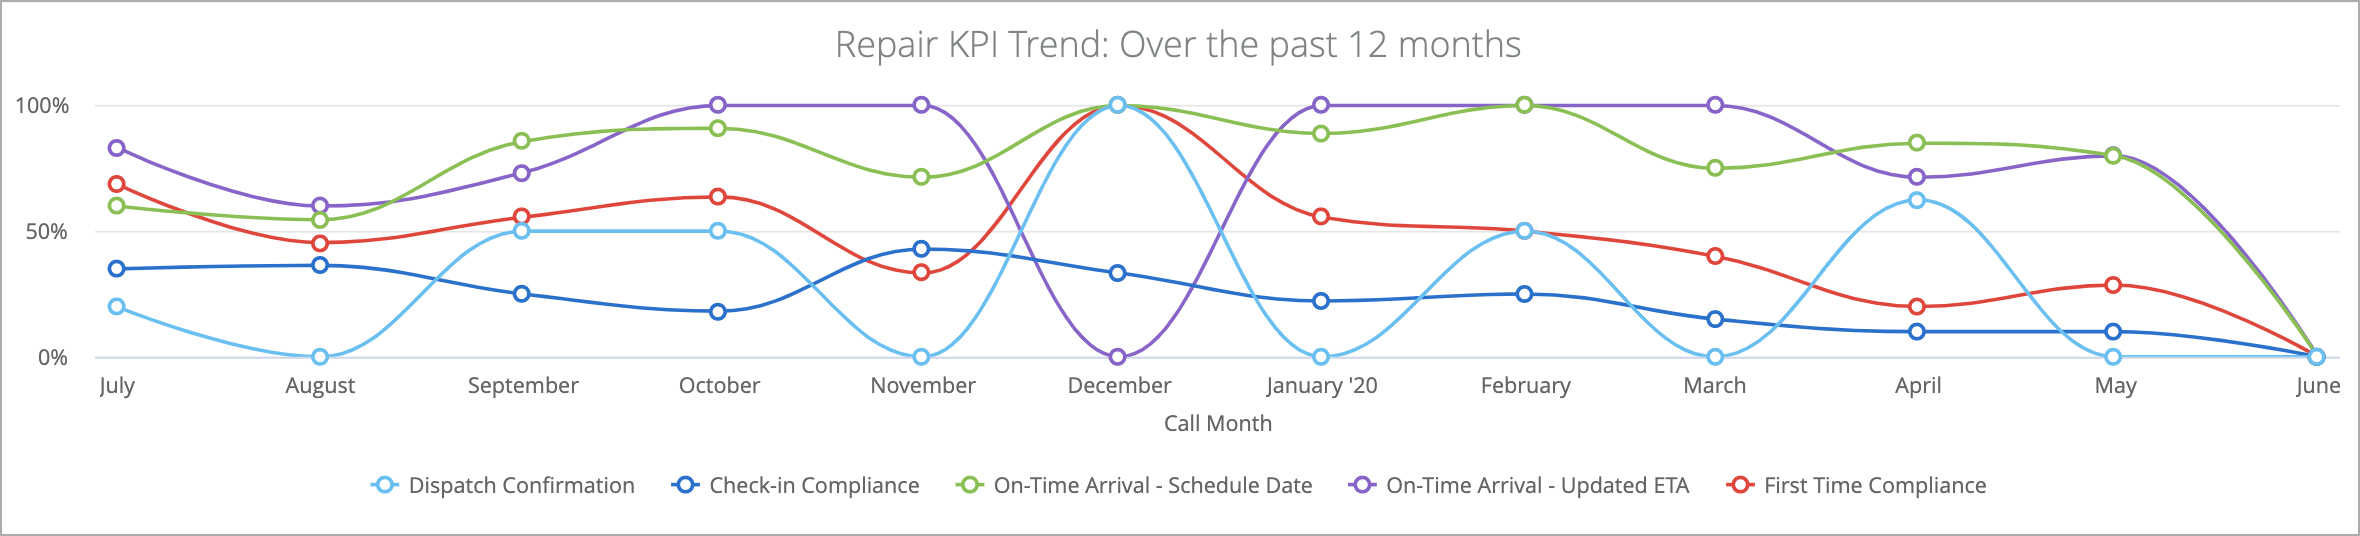
This 12-month trend graphs for the KPIs help identify whether the performance was consistent over the course of the past year. A straight-line graph with a high score indicates a consistent and reliable performance, whereas a more wavy chart indicates inconsistencies in the KPIs. For maintenance work orders, you may also view the trends by quarter.
Hovering your mouse over a data point displays the score for that KPI for the corresponding month. Click a data point to drill down into that month's data.
| Anchor |
|---|
| repairheatmap |
|---|
| repairheatmap |
|---|
|
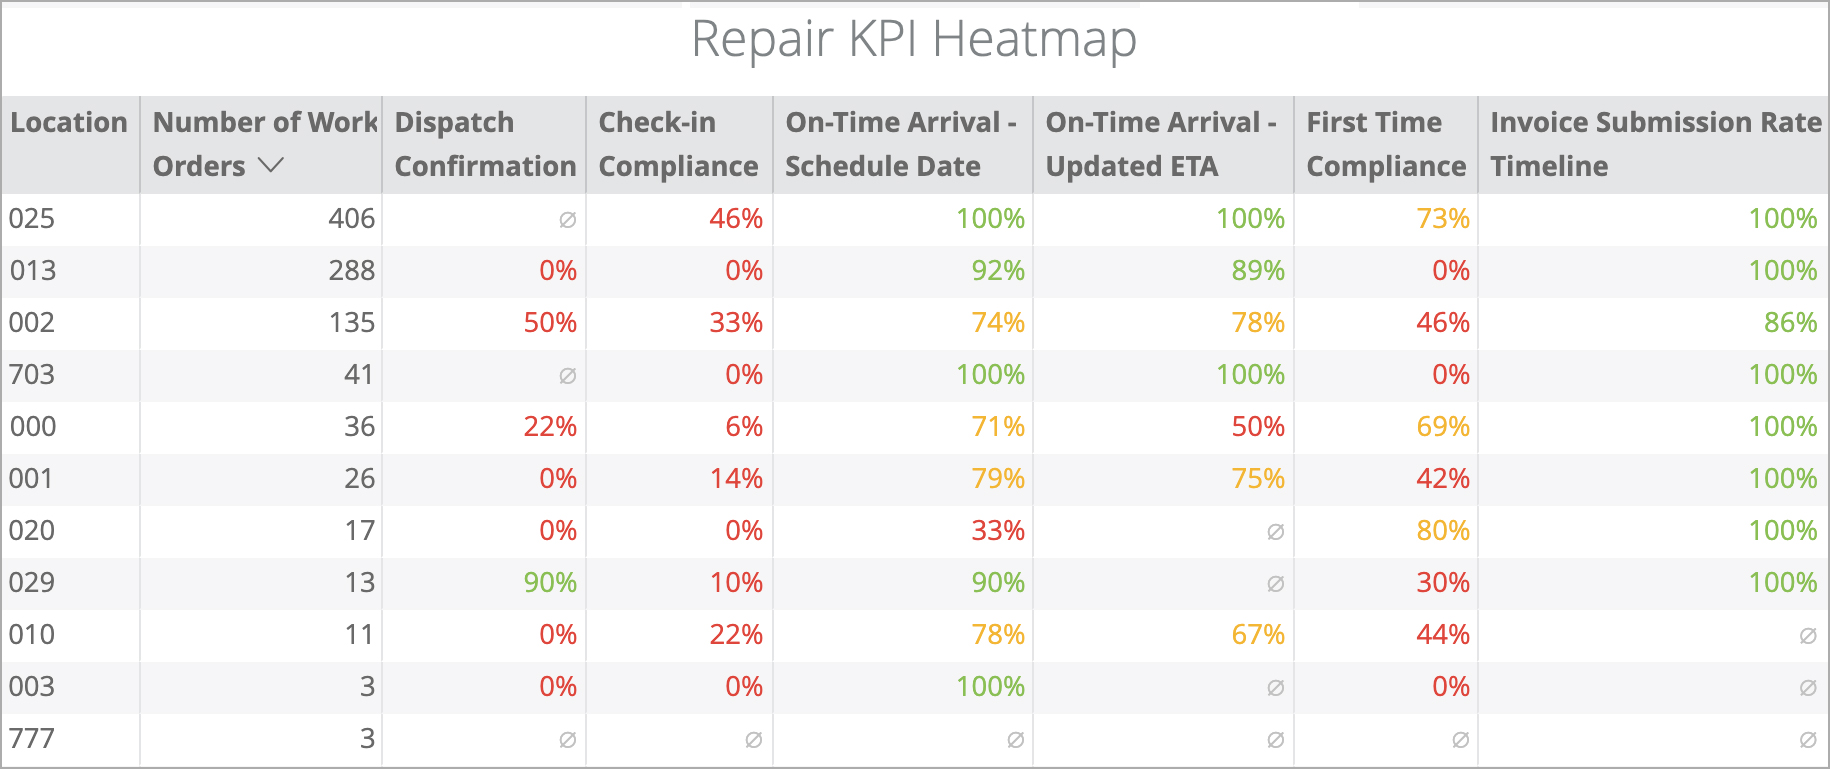
Repair KPI Heatmap
This section displays the score for each KPI by location. Performance levels are colored as follows: <50% red, 50-80% orange, >80% green.
Use this grid to identify locations that have poor performance. This grid also helps you understand why the score for a specific KPI is low - a few locations with low performance may bring the overall score for all locations down for a KPI.
| Anchor |
|---|
| commondatafeatures |
|---|
| commondatafeatures |
|---|
|
| Insert excerpt |
|---|
| All Calls Tab |
|---|
| All Calls Tab |
|---|
| nopanel | true |
|---|
|