The Repair KPI tab shows those indicators that measures performance for your provider company on work orders across all Clients (Subscribers) in the last 365 days for repair work orders, as well as KPI trends over the past year and KPI performance per location.
You can download the data and email reports to recipients.
| Note |
|---|
By default, the KPIs show data for all clients (Subscribers) within the past 365 days. Use the Subscriber filter in the all-inclusive filters along the top of the report to view by individual Clients, different date ranges, or other criteria, as needed. |
On this dashboard you will see:
Anchor repairkpis repairkpis
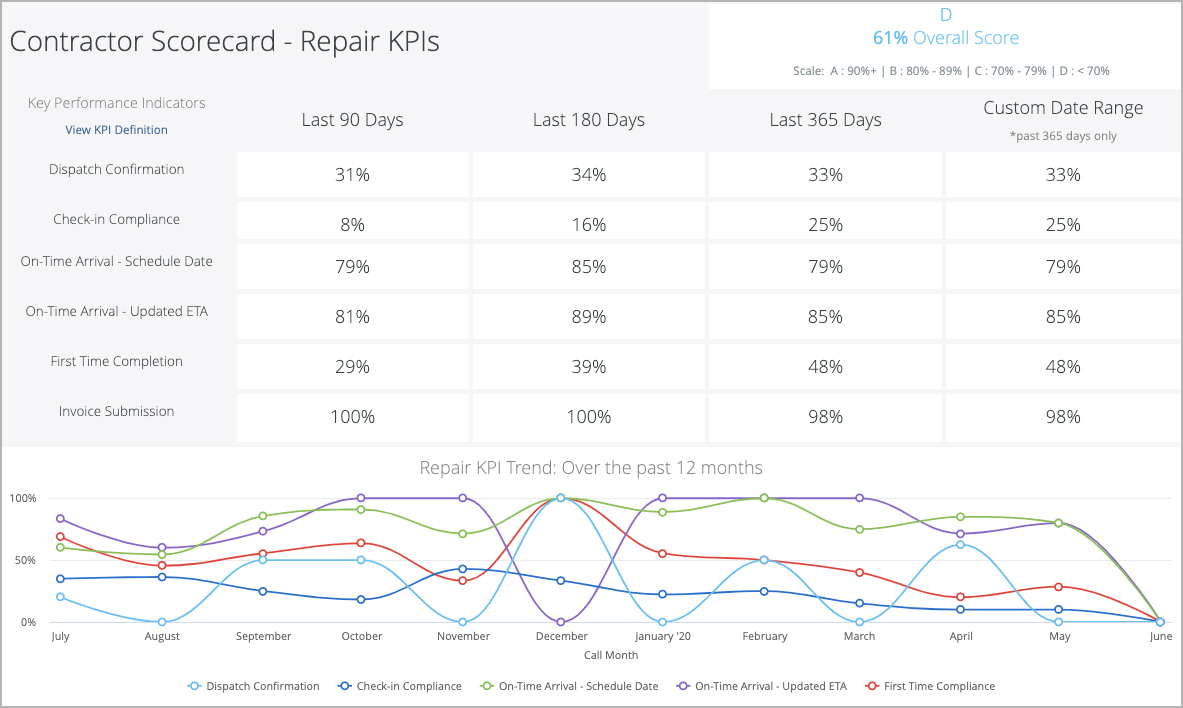
Repair Key Performance Indicators
| repairkpis | |
| repairkpis |
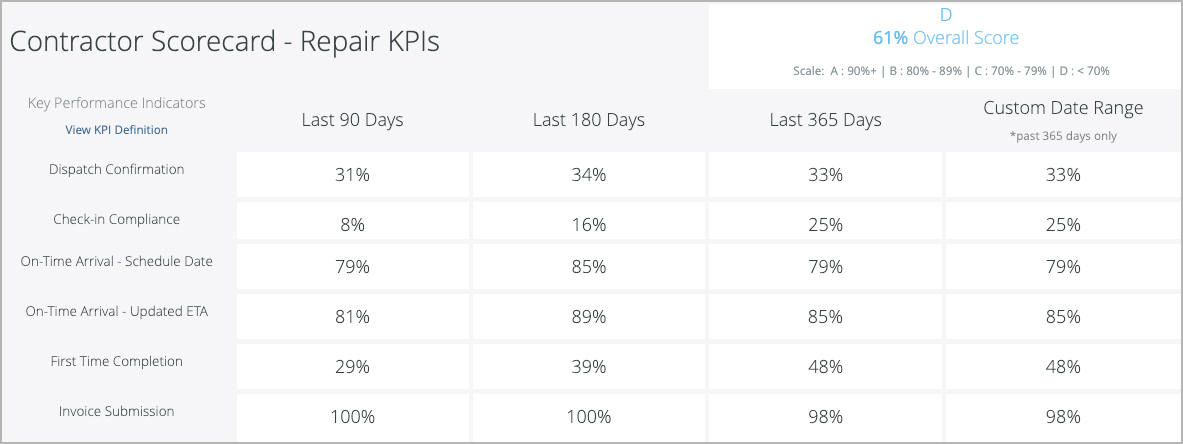
Here, you will see a matrix of Repair KPIs and the overall performance of your provider company over the past 90 days, 180 days, 365 days, or a custom date range under 365 days.
There are 6 Repair KPIs:
- Dispatch Confirmation: the percentage of work orders — with an ETA of up to 48 hours or less — that your provider company responds to in a timely fashion.
- Check-in Compliance: the percentage of completed work orders that have both a check-in and a check-out entry, with a minimum check-in time of 10 minutes.
- On-Time Arrival - Schedule Date: the percentage of work orders for which your provider company was on site before the original the date/time generated by the system when the work order was dispatched.
- On-Time Arrival - Updated ETA: the percentage of on-time arrival for work orders with an updated scheduled date.
- First Time Completion: the percentage of work orders that were fixed on the first visit with only 1 check-in and 1 check-out recorded on the same day (or within 24 hours for overnight work orders).
Invoice Submission (within 30 days): the percentage of work orders with invoice submitted within 30 days of the work order being marked as Completed/Confirmed.
Briefly, each KPI has a calculated Score, which is the percentage of work orders that meet the criteria for that KPI:
Individual KPI Score (%) = Number of Compliant Work Orders ÷ Total Work Orders
(rounded to the nearest whole number)
The sum of all KPI Scores gives an Overall Score:
Overall Score = Sum of all KPI scores ÷ Total number of eligible KPIs
The Overall Score is then mapped to a Grade, which represents overall performance.
| Info |
|---|
See Key Performance Indicators (KPIs) for Repair Work Orders for more information on the KPIs, and Calculations for KPI Scores and Overall Grade for more information on KPI scores and overall grades. |
| Anchor | ||||
|---|---|---|---|---|
|
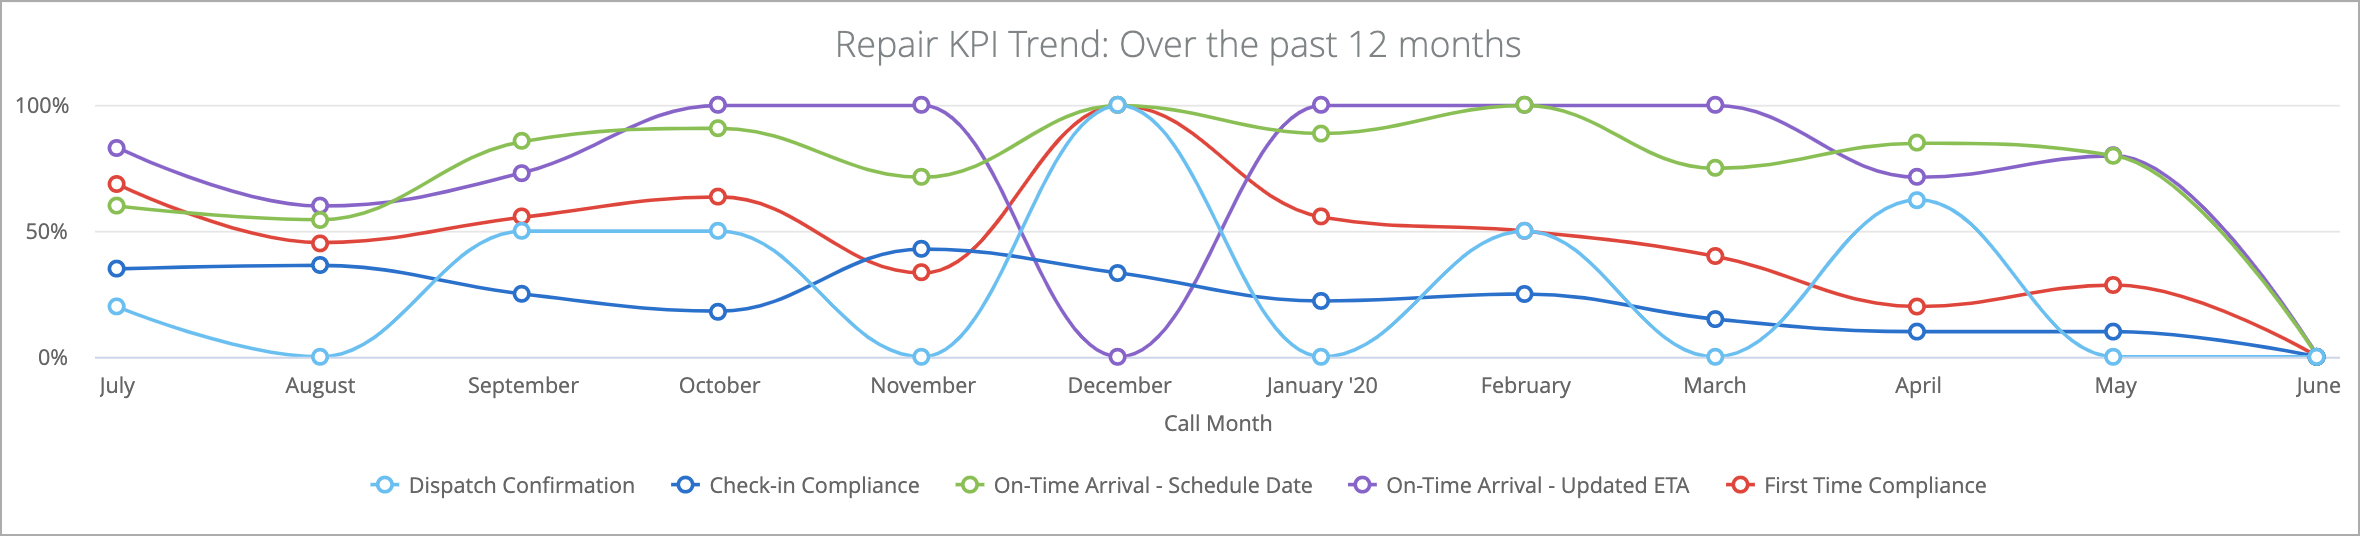
This 12-month trend graphs for the KPIs help identify whether your company's performance was consistent over the course of the past year. A straight-line graph with a high score indicates a consistent and reliable performance, whereas a more wavy chart indicates inconsistencies in the KPIs. For maintenance work orders, you may also view the trends by quarter.
Hovering your mouse over a data point displays the score for that KPI for the corresponding month. Click a data point to drill down into that month's data.
| Anchor | ||||
|---|---|---|---|---|
|
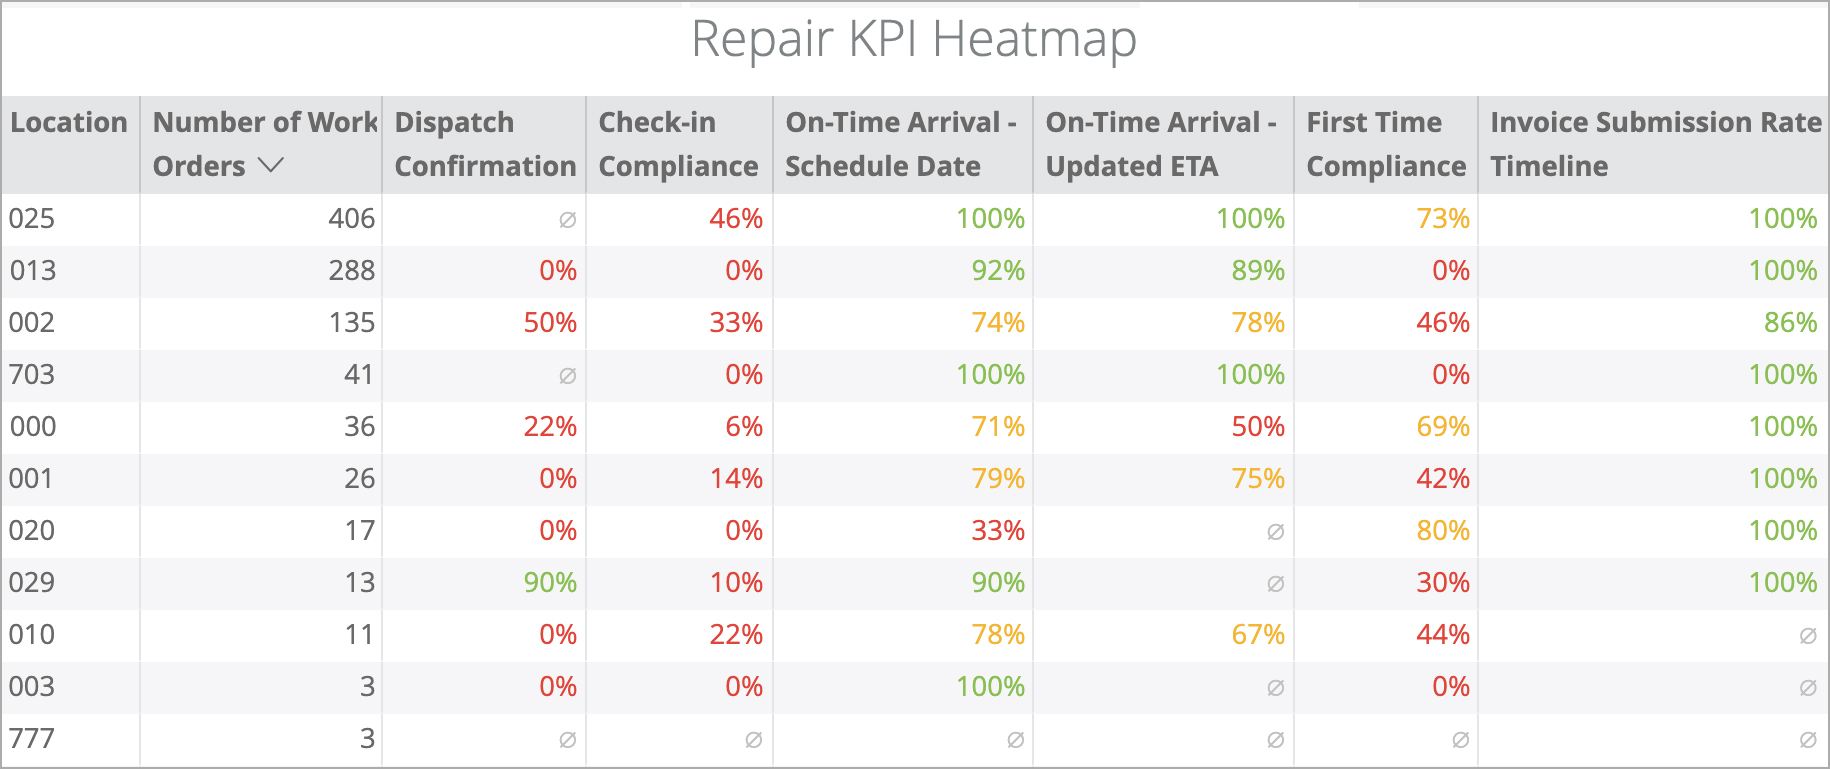
This section displays the score for each KPI by location. Performance levels are colored as follows: <50% red, 50-80% orange, >80% green.
Use this grid to identify the locations where the KPIs were not met. This grid may help you understand why the score for a specific KPI is low: a few locations where compliance was low will bring down your overall score.
| Anchor | ||||
|---|---|---|---|---|
|
| Insert excerpt | ||||||
|---|---|---|---|---|---|---|
|

